
“U.S. acres burned each year are much fewer now — even in our worst years — than was the case in the early 20th century.”


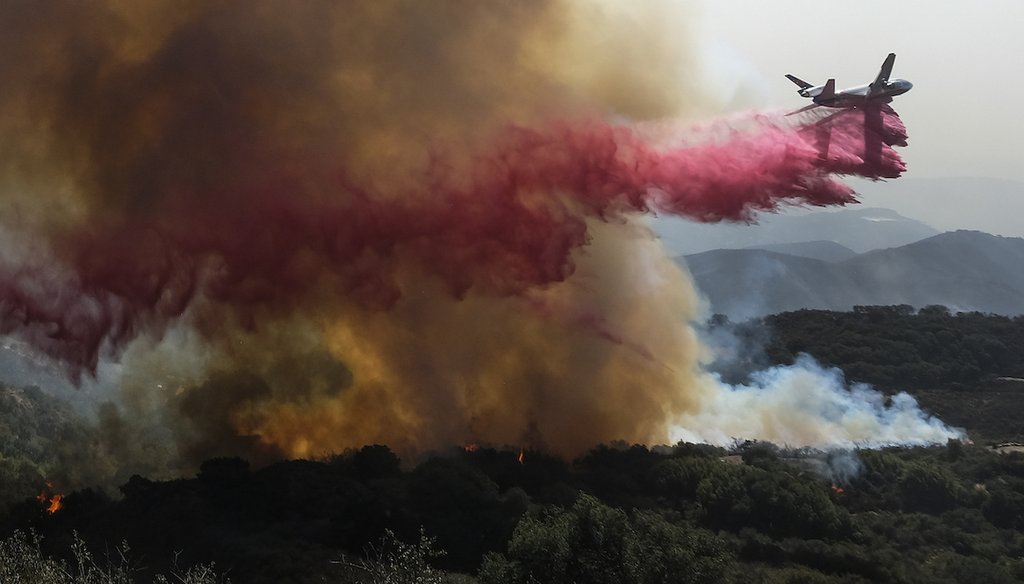
An air tanker drops retardant on a wildfire in Goleta, Calif., part of the 22 square mile Alisal Fire. (AP Photo)

Flawed government data appears to show a massive decline in wildfires after 1930.
The data suffered from double and triple counting, and in the 1920s and 1930s, federal officials wrongly recorded millions of acres of intentional fires as wildfires.
The best assessments suggest that fires today are about on the scale the country saw in the first few decades of the 20th century.
The wildfire season in the U.S. has gotten longer. In recent decades, what once lasted four months has grown to six or even eight months. Climate change makes summers warmer, but past forest management has also left forests with more fuel to ignite.
An article from the conservative Heartland Institute argues that the role of climate change is "grossly overemphasized."
"U.S. acres burned each year are much fewer now — even in our worst years — than was the case in the early 20th century," the Oct. 11 article said.
The author points to U.S. government data that shows a dramatic drop in the number of acres burned, from over 40 million in 1930 down to 10 million around 2015.
The problem is, federal officials have known for some time that their data was unreliable, and this year, they took most of it off their website (which drew accusations of cherry picking the numbers from the Heartland Institute).
Many factors made the data shaky. Perhaps the most intriguing part of this story of bad data is that the government’s old information includes millions of acres in the 1920s and 1930s that burned not by accident, but by intent. On top of that, there was also double counting, and, as some see it, undercounting.
The Heartland Institute pointed to this chart to back up their claim about wildfire trends. The data came from the National Interagency Fire Center.
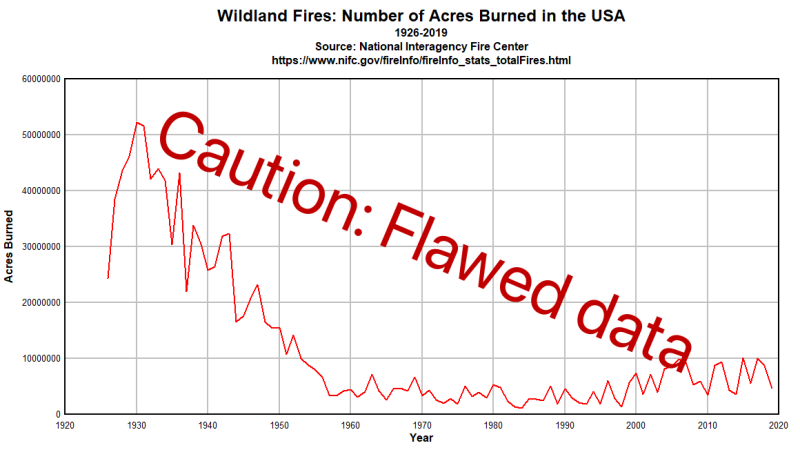
A fact-sheet from the conservative Heartland Institute used this chart based on federal data.
If you go to the federal center’s wildfire page today, you will find this message: "Prior to 1983, the federal wildland fire agencies did not track official wildfire data using current reporting processes. As a result, there is no official data prior to 1983 posted on this site."
A 2015 article from a Forest Service researcher explained why that data was unreliable. She wrote that multiple federal, state and local agencies filled out fire reports each in their own way, using different approaches to report different kinds of information. The article talked about records "compromised by inherent reporting biases, inconsistencies and errors or uncertainty in the data."
There were instances when fires were counted twice, or more, said John Abatzoglou, a fire researcher at the University of California Merced.
"Some fires can be counted in triplicate as multiple agencies responding to the fire would count that fire in their summary statistics," Abatzoglou said.
The Heartland article author, senior fellow H. Sterling Burnett, minimized that concern.
"It’s not that there isn’t any overcounting," Burnett said. "But people managing federal agencies were smart enough to notice when two organizations reported the same fire."
As a record of the total number of acres burned over many years, historian Stephen Pyne, Arizona State University professor emeritus, said he thinks the government probably underestimated the damage.
"Most of the country outside federal lands was not counted at all," Pyne said.
The most certain conclusion about the government numbers behind the chart is that they can’t be trusted.
But many experts who have dug into the archives talk about a major flaw that greatly inflated the federal statistics. They describe how conflict between the U.S. Forest Service and southern landowners likely threw off the totals by millions of acres.
In a 2018 article, Randal O’Toole, a senior fellow with the libertarian Cato Institute, included that same chart showing the dramatic fall in wildfires based on federal data. O’Toole is skeptical of broad claims of climate change. But O’Toole offered this chart with a stinging caption.


"Some people use the data behind this chart to argue against anthropogenic climate change. The problem is that the data before about 1955 are a lie."
O’Toole noted that at the turn of the 20th century, Congress told the Forest Service to suppress fires. This mandate put the federal agency in direct conflict with landowners in the southeast. The Forest Service was steadfast in its opposition to all fires. But the southeaster landowners burned their forests every four or five years to control underbrush.
"Perhaps 20% of forests would be burned each year, compared with less than 1% of forests burned through actual wildfires," O’Toole wrote. "The Forest Service responded by counting all fires in that state, prescribed or wild, as wildfires."
There is broad agreement on this problem.
"The early U.S. Forest Service wildfire activity summaries do include millions of hectares of intentional burning on ‘unprotected’ lands, which, until approximately the mid-20th century was viewed by the U.S. Forest Service as akin to wildfire, as something that should be prevented and ultimately eradicated," the Forest Service researcher wrote in that 2015 article.
That wasn’t exactly news. Researchers for an outside report commissioned by the Forest Service wrote in 2003 that "in excess of 10 million acres were burned by wildfires annually" between 1930 and 1950.
"Most of the area burned during this period was in the Southeastern United States and were primarily incendiary fires," the authors wrote. (Incendiary fires are intentional fires.)
We raised these issues of the unreliability of the federal database with Heartland’s Burnett. He said many articles in peer-reviewed journals had also relied on it.
"You can only go with the data you have," Burnett said.
He said even if the numbers are flawed, the number of acres lost to wildfires today is still less than it was in 1930. That’s unlikely.
No expert we reached knew of any national study that could fix the errors in the government’s original data. But there has been a lot of work done on the western states where the largest fires take place.
Jeremy Littell with the Department of Interior Alaska Climate Science Center, along with several colleagues, examined fire reports for 11 western states — Arizona, California, Colorado, Idaho, Montana, Oregon, New Mexico, Nevada, Utah, Washington and Wyoming.
They used a blend of federal, state and regional reports, and they filtered out intentional fires, only counting burns on federal or federally-protected land. They looked at the years 1916 to 2020
The peak of 7.4 million acres burned came in 2012. But the next highest, 6.7 million, came in 1919. Among the top 20 highest years, a bit more than half, 13, took place after 1987. The rest came before 1932. The fact is, there were some huge fires at the turn of the century.
"The large fire years in the West between about 1916 and the late 1930s were comparable to those in recent years," Littell said.
Littell said the triggers for large fires are the same today as they were in the first decades of the 1900s. Hot and dry summers in a preceding year lead to worse fire seasons. And since 1980, those conditions have become more common.
The Heartland Institute said, "U.S. acres burned each year are much fewer now — even in our worst years — than was the case in the early 20th century." The claim was based on federal data.
However, over the years, researchers concluded that the federal data was deeply flawed. While there might have been some undercounting, double and triple counting also took place. Most damaging of all, in the 1920s and 1930s, millions of acres of intentional fires in the southeast were counted as wildfires.
One climate change skeptic called the government data "a lie." This year, the government withdrew its original dataset, and now only provides counts starting in 1983.
There is no national level analysis going back to the turn of the last century, but an analysis of 11 western states suggests that the toll of fires today is at least on par with the fires in the first few decades.
We rate this claim Mostly False.
Heartland Institute, The Hill Is Wrong, Climate Change Is Grossly Overemphasized as a Factor Causing Wildfires, Oct. 11, 2021
Climate at a Glance, U.S. Wildfires, accessed Oct. 12, 2021
Heartland Institute, National Fire Center Disappears ‘Inconvenient’ U.S. Wildfire Data, May 12, 2021
National Interagency Fire Center, Total Wildland Fires and Acres (1983-2020), accessed Oct. 12, 2021
International Journal of Wildfire, Sources and implications of bias and uncertainty in a century of US wildfire activity data, July 2, 2015
New Geography, The Sordid History of Forest Service Fire Data, Sept. 27, 2019
Ecological Applications, Climate and wildfire area burned in western U.S. ecoprovinces, 1916–2003, June 1, 2009
Proceedings of the National Academy of Sciences, Long-term perspective on wildfires in the western USA, Jan. 10, 2012
Proceedings of the National Academy of Sciences, Impact of anthropogenic climate change on wildfire across western US forests, July 28, 2016
National Academies Press, A Century of Wildland Fire Research: Contributions to Long-term Approaches for Wildland Fire Management: Proceedings of a Workshop, 2017
North Carolina State University, Geo-spatial Analysis of Socioeconomic Risk Factors Affecting Wildfire Arson Occurrence in the Southeastern United States, 2012
International Journal of Wildland Fire, Forest fire causes and extent on United States Forest Service lands, 2005
Geophysical Research Letters, A Shorter, Sharper Rainy Season Amplifies California Wildfire Risk, Feb. 24, 2021
...And then there’s physics, The Mysterious Wildfire Chart, Oct. 30, 2013
Geophysical Research Letters, Global Emergence of Anthropogenic Climate Change in Fire Weather Indices, Nov. 30, 2018
U.S. Forest Service, Criteria and indicators for the sustainable management of temperate and boreal forests of the United States, 2003
Harpers Magazine, Southerners Who Set the Woods on Fire, July 1958
U.S. Department of Agriculture, Wildfires in All Seasons?, July 29, 2021
California Department of Forestry and Fire Protection, 2021 Fire Season Outlook, accessed Oct. 14, 2021
California Department of Forestry and Fire Protection, Top 20 Largest California Wildfires, Oct. 6, 2021
Interview, H. Sterling Burnett, senior fellow, Heartland Institute, Oct. 14, 2021
Email exchange, Stephen Pyne, professor emeritus of environmental history, Arizona State University, Oct. 13, 2021
Email exchange, John Abatzoglou, associate professor, School of Engineering, University of California Merced, Oct. 13, 2021
Email exchange, Max Moritz, adjunct professor of fire ecology and management, University of California Santa Barbara, Oct. 13, 2021
Email exchange, Jeremy Littell, research ecologist, Department of Interior Alaska Climate Science Center, Oct. 13, 2021


In a world of wild talk and fake news, help us stand up for the facts.