"When LBJ started #WarOnPoverty, 14% of Americans lived in poverty. 50 yrs later, 14% still do. There's a #BetterWay."


Our only agenda is to publish the truth so you can be an informed participant in democracy.
We need your help.

Few things in American politics have been more hotly and consistently argued in the last half-century than the legacy of President Lyndon Johnson’s War on Poverty.
In a 1986 speech on welfare reform, President Ronald Reagan took several jabs at Johnson’s initiative, saying:
"[When] the famous War on Poverty was declared... a funny thing happened. Poverty, as measured by dependency, stopped shrinking and then actually began to grow worse. I guess you could say, poverty won the war."
Today, the bipartisan debate continues. Democrats and Republicans argue whether welfare programs work and if the poverty rate actually shrank since Johnson declared the War on Poverty.
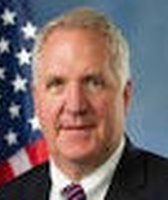
On June 7, U.S. Rep. John Shimkus, R-Ill., tweeted:
Shimkus was promoting House Speaker Paul Ryan’s "A Better Way" agenda that looks at, among other things, poverty and welfare reform.
But just as America has changed since the Johnson administration, so has the way the government measures poverty. Does Shimkus take those changes into consideration in his tweet? We decided to investigate his claims about the nation’s poverty record and how much it has changed since the War on Poverty was declared.
First off, what is poverty?
Every year the United States Census Bureau updates the thresholds it uses to define the official poverty rate. The thresholds help the Bureau when it gathers statistics for its annual report on income and poverty. Here are the key things to know about those thresholds:
Using the Consumer Price index, thresholds are updated based on the country’s inflation rate.
The same poverty calculation is used across the country regardless of a person’s location, which means the same criteria is used for a person living in New York City or Peoria.
The Bureau looks at income before taxes and doesn’t include non-cash benefits like public housing, Medicaid and food stamps.
In 2010, the Census Bureau also started producing the Supplemental Poverty Measure (SPM), which takes into account place of residence, government benefits and necessary expenses like taxes. The SPM offers another perspective on poverty, calculating the factors missed in the official poverty report. (See a side-by-side comparison of the SPM and official rates here.)
A deeper dive into poverty
Shimkus press secretary Jordan Haverly told PolitiFact Illinois that Shimkus pulled the data for his tweet from page 5 of the "A Better Way" guide, which shows an overview of the welfare system. The graph below shows the data in the "A Better Way" guide is consistent to that of the Census Bureau. The vertical stripes in the charts represent periods of recession.
"A Better Way," Page 5

Shimkus' tweet says that 14 percent of Americans lived in poverty at the dawn of the War on Poverty and 14 percent still do. It’s meant to show the country’s poverty situation hasn’t made much progress more than five decades after the declaration after the War on Poverty began. A surface-level look into the Census Bureau data from 1966 to 2014 backs that claim.
However, many researchers consider the methods used by the Bureau to be outdated, and say its studies do not accurately reflect the poverty rate in the United States.
If given the option, 90 percent of academics and researchers would favor a move away from the reliance on the official poverty rate data, according to Timothy Smeeding, the Lee Rainwater Distinguished Professor of Public Affairs and Economics at the University of Wisconsin-Madison. Smeeding said because the Supplemental Poverty Measure takes into account government contributions when determining whether a person is poor, it’s better for tracking the number of poverty-stricken people in the country than the official rate.
"The SPM is a measurement that takes a look at all the things we think are important, all the things we spend money on," Smeeding said. "The official rate doesn’t make a lot of sense. But if you want to say the War on Poverty is a failure, then take a look at the official numbers."
Smeeding said politicians are often more comfortable with the official rate, especially if their state gets a lot of government funding because of it.
"No politician would ever pitch a move to the SPM because it might mean the state’s poverty level would decrease and they would get less money," Smeeding said.
A 2013 study by Columbia University backs that claim. Researchers found if the Bureau incorporated government programs into the official poverty rate, the rate would have significantly decreased over time. Using historical data, the Columbia researchers found the poverty rate would have fallen from 26 percent in 1967 to 16 percent in 2012 if the Bureau used the SPM.
Shimkus’ tweet only uses the Census Bureau’s data.
The numbers and Shimkus’ wording
Shimkus said the poverty rate was 14 percent when Johnson declared the War on Poverty, and the poverty rate was still 14 percent 50 years later. The wording could be confusing to someone unfamiliar with the history of the War on Poverty.
First, Shimkus’ tweet implies Johnson started the War on Poverty exactly 50 years ago. Johnson actually declared the War on Poverty in 1964 during his State of the Union Address, which was 52 years ago.
Second, in 1966 the poverty rate was 14 percent, but at the time of Johnson’s 1964 address, the poverty rate was 19 percent.
Our ruling
Shimkus said, "When LBJ started #WarOnPoverty, 14% of Americans lived in poverty. 50 years later, 14 percent still do. There’s a #BetterWay
Shimkus isn’t wrong saying the current poverty rate is 14 percent, according to the most recent data. But the figures in his tweet come from a measurement standard most researchers regard as obsolete. A more accurate and widely-accepted gauge of poverty is the Supplemental Poverty Measure, though neither Shimkus’ tweet nor House Speaker Ryan’s "A Better Way" acknowledge it.
There’s also a problem with Shimkus’ timeframe. The War on Poverty began in 1964, but the tweet implies it dates only to 1966. Even using the obsolete Census Bureau "poverty rate" measure, there’s a 5 percentage point difference between 1964’s 19 percent and the 14 percent figure of 50 years ago in 1966. By that measure, the rate dropped 5 percentage points.
Finally, his tweet implies the poverty rate remained stagnant from 1966 to today. As shown in the graph above, the poverty rate continuously has spiked and dipped over the past 50 years, with the sharpest increases coming during periods of recession.
We rate this claim Mostly False
https://www.sharethefacts.co/share/87285bb3-2074-4f9d-b7ed-df5f616a2b31A Better Way campaign, July 13, 2016
Columbia University poverty study, July 13, 2016:
Email with Shimkus press secretary Jordan Haverly, July 13, 2016
U.S. Census Bureau, How the Census Bureau Measures Poverty, July 13 and 26, 2016
Income and Poverty in the United States: 2014, July 13, 2016
Ronald Reagan’s 1986 Radio Address to the Nation on Welfare Reform,
Email with Shimkus press secretary Jordan Haverly, July 14, 2016
Measuring Poverty: A New Approach, July 14, 2016
Stanford Center on Poverty & Inequality, "Poorer by Comparison, Poverty Work, and Public Policy in Comparative Perspective." By Timothy Smeeding, July 26, 2016
Timothy Smeeding, Lee Rainwater Distinguished Professor of Public Affairs and Economics at the University of Wisconsin-Madison, phone interview July 26, 2016
U.S. Census Bureau, Measuring America: How Census Measures Poverty, July 26, 2016


In a world of wild talk and fake news, help us stand up for the facts.