

While campaigning this month in Cleveland, President Barack Obama reframed his general election fight with Mitt Romney as a battle between the haves and the have-nots.
Casting himself as a champion for the latter, Obama argued that his Republican opponent embraced fiscal policies that helped steer the country into recession.
The election, he said, will be "a make-or-break moment for America’s middle class."
The address at Cuyahoga Community College followed remarks that same afternoon from Romney in Cincinnati. Combined, the events offered a preview of how each will spend the coming months positioning himself as the candidate who can steer an economic recovery.
The dueling speeches were considered far and wide to represent a key moment, given that it was the first time Obama and Romney had campaigned in the same state on the same day. Leaving aside the rhetoric, PolitiFact Ohio decided to look closer at the numbers the president used to make his case. In particular, two figures Obama shared at Tri-C caught our attention.
"Over the last few decades," Obama said early in his 53-minute speech, "the income of the top 1 percent grew by more than 275 percent -- to an average of $1.3 million a year."
The president had painted a picture of inequality. But was it an accurate one?
Let’s start with the first half of the statement. Data released last October by the independent Congressional Budget Office shows that, on average, those Americans among the richest 1 percent saw their after-tax household income rise 275 percent between 1979 and 2007.
Those not quite as prosperous but nonetheless among the top 20 percent saw income grow by 65 percent over that period. Middle-class incomes grew roughly 40 percent. And among the bottom 20 percent, income was about 18 percent higher in 2007 than in 1979.
So while income increased across the board, the top 1 percent easily outpaced the pack.
"As a result of that uneven income growth, the distribution of after-tax household income in the United States was substantially more unequal in 2007 than in 1979," the CBO reported. "In fact, between 2005 and 2007, the after-tax income received by the 20 percent of the population with the highest income exceeded the after-tax income of the remaining 80 percent."
The second half of Obama’s statement can be traced to a report from the Organization for Economic Cooperation and Development, a group of 34 developed countries that sets international standards on a wide range of topics.
The report, released in December and titled "Divided We Stand: Why Inequality Keeps Rising," found that, on average, the wealthiest 1 percent of Americans earned $1.3 million a year after taxes. Though Obama didn’t mention it in his speech, that figure dwarfs the average $17,700 made by the poorest 20 percent, according to the OECD.
Before we get to the Truth-O-Meter, there are three points worth raising.
First, while Obama said that growth for the richest 1 percent was more than 275 percent, the CBO study adds no such quantifier. The president indulged in some hyperbole, but not so much that it created a false impression that the disparity is measurably larger than it is.
Second, Obama time-pegged his assertion to "the last few decades." Obama’s speech focused singularly on the policies of his Republican predecessor, George W. Bush. Also in the White House during those decades were two Democrats: Jimmy Carter and Bill Clinton.
The third point comes via the Washington Post. When fact-checking Obama’s Tri-C speech, the Post’s Glenn Kessler noted that while it’s accurate that the average income among the top 1 percent is $1.3 million, describing top earners that way is "an interesting sleight of hand."
According to the CBO, you’re in the top 1 percent if your household income exceeds $352,000. "By using an average," Kessler wrote, "Obama is able to cite a much higher figure."
But it’s also important to stress that the numbers Obama used come from agencies respected for independence. These three points, while helpful in painting a fuller picture, do not diminish the accuracy of the numbers or the context in which the president delivered them. Knowing them, though, provides some clarification.
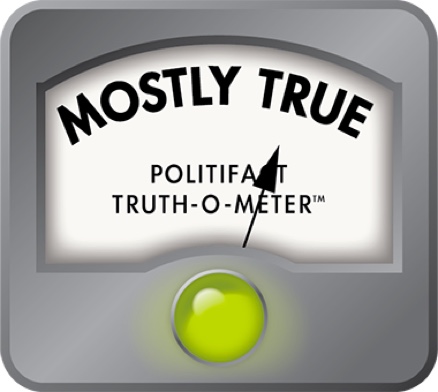
As such, we rate Obama’s statement Mostly True.
The Plain Dealer, "President Barack Obama reframes economic message as he and Mitt Romney stump in Ohio," June 14, 2012
The White House Office of the Press Secretary, transcript of president’s remarks at Cuyahoga Community College in Cleveland, June 14, 2012
Congressional Budget Office, "Trends in the Distribution of Household Income Between 1979 and 2007," released in October 2011
Organization for Economic Cooperation and Development, "Divided We Stand: Why Inequality Keeps Rising - Country Note: United States," released Dec. 5, 2011
The Washington Post, "Fact checking the dueling Obama and Romney economic speeches," June 15, 2012;
Congressional Budget Office fact sheet, "Income Category Minimums for All Households," for years 1979-2007, accessed June 26, 2012, at CBO.gov
In a world of wild talk and fake news, help us stand up for the facts.