"Baltimore spends the third highest per capita on its public schools."


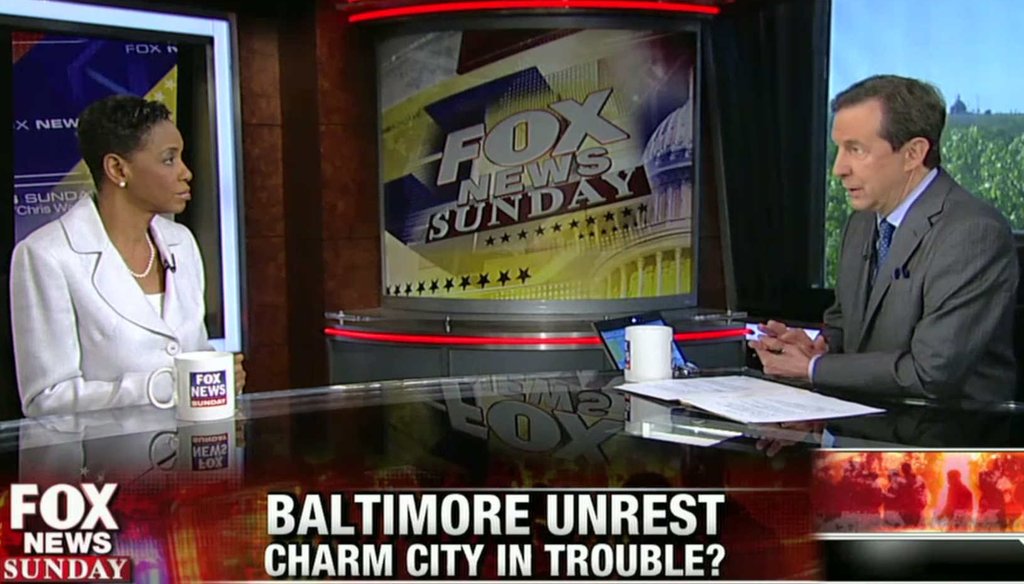
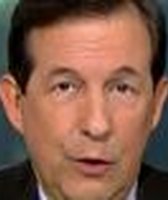
Fox News Sunday host Chris Wallace interviews Rep. Donna Edwards, D-Md., about the causes of the unrest in Baltimore.

The Baltimore riot has many people talking about how life could be improved in neighborhoods that have been in the grip of poverty for many decades. Rep. Donna Edwards, D-Md., said on Fox News Sunday that investing in schools is an obvious step.
But host Chris Wallace pushed back.
"It’s not a matter of money," Wallace said on May 3, 2015. "One of the things that we learned this week is Baltimore spends the third-highest per capita on its public schools. Baltimore was already spending plenty on public schools, and the schools were still lousy."
To get to "third-highest," Wallace is counting only the 100 largest school districts -- and lopping off more affluent communities in the process.
Fox News told us that Wallace relied on a Census Bureau release that compared the 100 largest school districts nationwide. (Wallace misspoke slightly. He should have said per-pupil spending, not per capita.) Among the 100 largest districts, Baltimore does spend more per pupil than all-but two other districts:
School district
Enrollment
$ per pupil
New York City
990,145
$20,226
Boston
55,027
$19,720
Baltimore
84,212
$15,287
Anchorage
48,765
$14,963
Montgomery County
146,459
$14,873
The problem is there are more than 15,000 school districts across the country, and there are hundreds that spend more. Among school districts with at least 5,000 students, Baltimore ranks 160th in spending. Or to give another example, Baltimore ranks 20th among the 500 largest school districts:
Rank
School District
Enrollment
$ per pupil
Rank
School District
Enrollment
$ per pupil
1
Newark
35,543
$23,946
11
Jersey City
27,397
$18,259
2
New York City
990,145
$20,226
12
Brentwood, N.Y.
17,143
$18,034
3
Elizabeth, N.J.
23,386
$20,220
13
New Haven
20,554
$17,615

4
Boston
55,027
$19,720
14
District of Columbia
44,618
$17,468
5
Buffalo
32,723
$18,971
15
Arlington County, Va.
21,892
$17,338
6
Hartford
20,931
$18,843
16
Christina, Del.
16,303
$17,026
7
Yonkers
25,326
$18,798
17
Waterbury, Conn.
18,061
$16,030
8
Rochester
31,432
$18,762
18
Pittsburgh
26,653
$15,615
9
Paterson, N.J.
24,365
$18,590
19
Springfield, Ma.
25,185
$15,374
10
Syracuse
20,491
$18,387
20
Baltimore
84,212
$15,287
The spending vs. results debate
Wallace simplified a complex problem when he said improving Baltimore’s schools "is not about money." There are studies on both sides of that debate.
To pick one that supports Wallace’s view, researchers looked at four years of data on Pennsylvania schools. In 2010, the 21st Century Partnership for STEM Education in Philadelphia compared spending in nearly 500 school districts to 11th grade test results. The strongest predictor of high scores was the fraction of adults in the district with a four-year college degree. F. Joseph Merlino is the organization’s president.
"You would think that spending more money would lead to better outcomes," Merlino said. "But the results are very weak."
The report said "Spending per pupil, regardless of expenditure category, had either no association with student achievement or at best only a weak positive or a weak negative correlation with student achievement. "
On the other hand, professors at Northwestern University and the University of California-Berkeley looked at four decades in school districts where spending increased under court order. In a report published by the National Bureau of Economic Research, they said that for low income children who spent all 12 years in schools where spending rose at least 20 percent, graduation rates rose by 23 percentage points.
There were also "25 percent higher earnings, and a 20 percentage-point reduction in the annual incidence of adult poverty." At the same time, increased spending had little impact on the education of children from families making more money.
Our ruling
Wallace said that Baltimore ranks third in per capita school spending.
That's only true if you look at the 100 largest school districts. Among the top 500, Baltimore ranks 20th. Among school districts with at least 5,000 students, Baltimore ranks 160th in spending.
Wallace's claim is partially accurate but leaves out important details. We rate it Half True.
Fox News, Fox News Sunday, May 3, 2015
U.S. Census Bureau, For the First Time, Public Education Revenue Decreases in 2012, Census Bureau Reports, May 22, 2014
U.S. Census Bureau, Public Elementary–Secondary Education Finance Data, 2012
21st Century Partnership for STEM Education, Are Educational Expenditures Associated with 11th Grade Student Achievement in Pennsylvania School Districts?, November 2010
National Bureau of Economic Research, The Effect of School Finance Reforms on the Distribution of Spending, Academic Achievement, and Adult Outcomes, May 2014
Education Week, School Spending Increases Linked to Better Outcomes for Poor Students, May 29, 2014
National Bureau of Economic Research and Harvard University, Does local tax financing of public schools perpetuate inequality?, undated
Interview, Stephen Wheeler, education specialist, U.S. Census Bureau, May 4, 2015
Interview, Carly Shanahan, spokeswoman, Fox News, May 4, 2015
Email interview, F. Joseph Merlino, president, 21st Century Partnership for STEM Education, May 4, 2015


In a world of wild talk and fake news, help us stand up for the facts.