
Our only agenda is to publish the truth so you can be an informed participant in democracy.
We need your help.


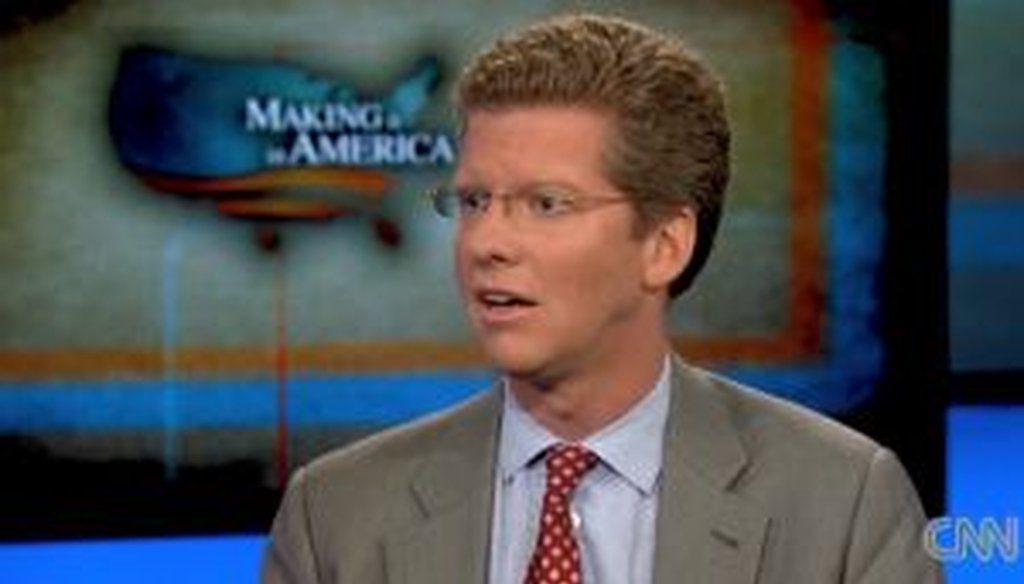
Secretary of Housing and Urban Development Shaun Donovan appeared on CNN's "State of the Union with Candy Crowley" on July 3, 2011. We checked a claim he made about housing prices.
The July 3, 2011, edition of CNN’s State of the Union with Candy Crowley featured an interview with Secretary of Housing and Urban Development Shaun Donovan. Crowley quickly turned to the troubles in the housing market.
She said, "By the numbers, when you came into office with the president, when he nominated you, 844,000 homes roughly were in foreclosure. 1.3 million right now are in foreclosure, and it's down a bit. Only 36 percent of people at this point, according to polls, approve of the way this administration has handled the housing crisis. Is there something more you can do?"
Donovan responded, "Well first of all, Candy, we have to recognize, this is the most serious crisis we've had in housing since the Depression. Housing prices have been dropping for 30 straight months when the president walked into the Oval Office, and they have stabilized, they've been about flat since the president came in."
He added, "So we've made a real difference. … But, rightly, the American people recognize we are not where we need to be. We still have a ways to go."
We were most interested in Donovan’s recap of housing price trends, so we checked to see whether housing prices did indeed drop "for 30 straight months when the president walked into the Oval Office, and they have stabilized, they've been about flat since the president came in."
We’ll start by saying that there’s no shortage of housing-price measurements. We found at least five that are conducted either monthly or quarterly, and because of varying methodologies, they all give slightly different snapshots of the housing-price market.
Here’s a rundown:
• S&P/Case-Shiller Home Price Index. This seasonally adjusted index looks at 20 major metropolitan areas, so it provides a limited -- though important -- assessment of the housing-price market.
Between July 2006 and January 2009, there were some modest (and temporary) upticks, but on the whole, the index fell by a significant amount -- a whopping 28 percent in the 30-month period, or nearly 1 percentage point per month on average.
During the Obama presidency, the index has continued to drop, though at a slower rate. Between January 2009 and April 2011, the index has fallen by about 4 percent, with drops in exactly half the months and increases in exactly half the months.
The most recent trendline, however, is negative: Prices have fallen for 11 straight months since June 2010.
• National Association of Realtors. This index, published by the trade association representing Realtors, tracks median prices for existing home sales on a national basis. The numbers are not seasonally adjusted, so month-to-month comparisons are subject to caution.
As with the Case-Shiller index, there were some modest upticks for the 30 months prior to the Obama presidency, but the general trendline was downward. The index dropped by 29 percent over the 30 months before Obama took office.
Since Obama has been in the Oval Office, prices have risen slightly -- 2.5 percent over the subsequent 28 months.
But as with Case-Shiller, the numbers most recently have been heading south: The index has fallen for six consecutive months.
• Federal Housing Finance Agency. This federal agency calculates its own price indexes, including a quarterly index that’s seasonally adjusted. It’s based on transactions backed by Fannie Mae or Freddie Mac, federally chartered companies that purchase mortgages on the secondary market. That means this index measures a subgroup of all transactions, but a significant one.
This index fell 11 percent between the third quarter of 2006 and the fourth quarter of 2008. Since the fourth quarter of 2008, the index has fallen an additional 8 percent, including declines in every single quarter of the Obama presidency.
• Freddie Mac House Price Index. Freddie Mac produces its own index as well. The Freddie Mac index blipped upward occasionally between July 2006 and January 2009, but overall, this index fell by a combined 20 percent before Obama entered the White House.
Then, between Obama’s January 2009 inauguration and March 2011, the index fell an additional 9 percent. The index has fallen for each of the most recent 11 months.
• CoreLogic Home Price Index. This index showed a 27 percent decline in the 30 months before Obama entered the Oval Office and a 6 percent decline since he took office. The index fell for nine straight months before recovering slightly in April and May of 2011.
Using these measures, then, Donovan overstated the case when he said that housing prices dropped "for 30 straight months when the president walked into the Oval Office." That’s not literally true by any of these indexes, though his underlying point -- that it was a rough 30 months for the housing market -- is confirmed by each of the indexes.
In addition, Donovan’s implication that the president deserves a significant amount of credit also holds some water, with the National Association of Realtors estimating that a homebuyers’ tax credit backed by Obama encouraged an additional 1 million home sales.
Less convincing is Donovan’s description of what has happened since Obama has entered office. If one uses a generous definition of "stabilized" -- performing better than previously -- then Donovan has a point. Since the start of 2009, housing prices have indeed avoided their historic declines of 2006, 2007 and 2008,
However, a more stringent definition of "stabilized" -- and a greater focus on Donovan’s wording "flat" -- would suggest a different conclusion. If you look at the five indexes, the overall change in housing prices since Obama took office are a 2.5 percent increase, a decline of 4 percent, a decline of 6 percent, a decline of 8 percent and a decline of 9 percent. And in four of those indexes, prices have been declining for between six to 11 months with no sign of a reversal.
When we contacted HUD with our findings, officials offered some explanations for the differences.
One difference is that HUD used three specific measures, rather than the five we looked at -- and two of those were variations on the ones we had looked at.
When using the Case-Shiller index, HUD used the non-seasonally adjusted version, even though that would not be considered the most appropriate way to make month-to-month comparisons. We checked their numbers, and, using this number, HUD is right that home prices declined for more than 30 consecutive months prior to Obama taking office. Using the seasonally adjusted numbers, as we did, it’s not the case.
When using the CoreLogic data, HUD relied on a separate measure of house prices that excludes distressed sales -- that is, it excluded urgent sales of houses due to negative conditions, such as a foreclosure.
How to count distressed sales is an important question when evaluating housing prices in the current market. As distressed homes work their way through the market, they will continue to be a drag on prices, which in turn will make it harder for the market to -- in Donovan’s word -- "stabilize." The National Association of Realtors expects distressed-home sales to exert negative pressure on the housing market for months to come.
We won’t judge whether HUD is justified in excluding distressed sales, but we do think it’s important to note that it does and, in doing so, reduces the impact of one factor holding back a rise in home prices.
The second difference between our research and HUD’s is that HUD started the clock in April 2009 -- not January 2009 -- under the argument that Obama could not have had an impact on the housing market until a few months into his presidency. This may sound like a small difference, but moving the starting date even three months actually changes the result significantly.
Using the three statistics HUD tracked, a switch from starting in January to starting April means that the decline in prices under CoreLogic decreases from 3.5 percent to 0.8 percent; the decline under Case-Shiller decreases from 5.1 percent to 0.3 percent; and the decline under FHFA decreases from 8.3 percent to 7.1 percent.
It’s certainly easier to call the CoreLogic and Case-Shiller numbers that start in April "stabilized" or "flat" than the ones starting in January. Then again, Donovan was pretty clear in his comment that he was starting the clock "when the president walked into the Oval Office," which would mean January.
So where does this leave us?
Donovan is right that things aren’t as bad as they were during the worst of the housing downturn, but we think he’s overstating the case when he says that housing prices are "stabilized" and "flat." The statistics HUD offered support that conclusion, but those numbers require starting the clock in April 2009 (which conflicts with Donovan’s statement); using a factor that helps the administration’s case (namely, excluding distressed sales); and using a non-seasonally-adjusted figure when a seasonally adjusted figure is available.
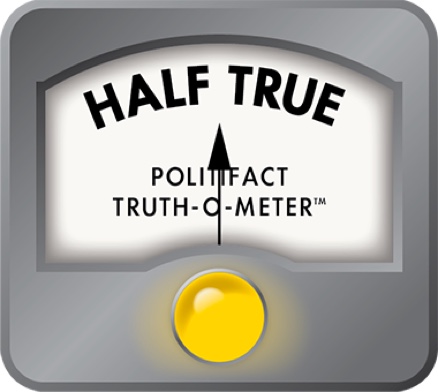
The reality is that there are a wide range of statistics one could use to analyze housing prices, each with advantages and shortcomings. Most of the statistics we looked at show that housing prices have continued to decline -- though at a slower rate -- since Obama took office, and the decline is especially clear over the last six months to a year. That is at odds with Donovan’s conclusion that they had stabilized and were "flat." On balance, we rate Donovan’s statement Half True.
Shaun Donovan, interview on CNN’s State of the Union with Candy Crowley, July 3, 2011
S&P/Case-Shiller Home Price Index historical table, accessed July 5, 2011
Federal Housing Finance Authority home price index, accessed July 5, 2011
Freddie Mac Home Price Index, accessed July 5, 2011
CoreLogic Home Price Index, accessed July 5, 2011
National Association of Realtors median sales prices for existing homes (historical tables provided by National Association of Realtors)
Interview with Walter Molony, senior public affairs specialist for the National Association of Realtors, July 5, 2011
Interview with Edward Szymanoski, associate deputy assistant secretary for economic affairs, July 6, 2011
In a world of wild talk and fake news, help us stand up for the facts.
