
Our only agenda is to publish the truth so you can be an informed participant in democracy.
We need your help.
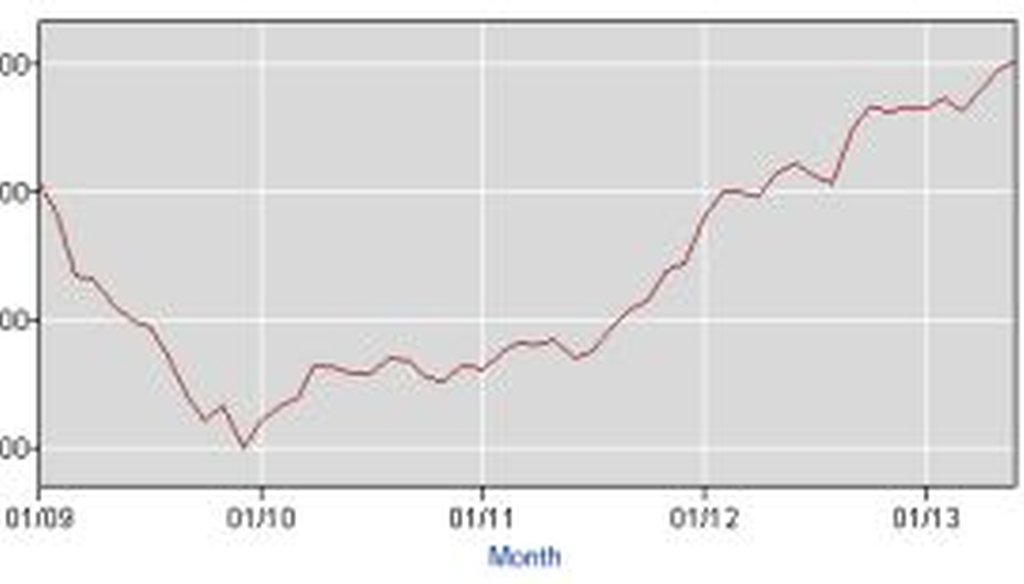
After the recession ended, the number of employed Americans has risen...

A reader recently asked us to check a claim that’s been widely repeated on conservative websites -- that 90 million Americans either aren’t working or aren’t looking for work. Over the past few months, the statistic has been cited by various conservative bloggers, pundits and news outlets.
We thought we’d take a closer look.
Here’s how the calculation is made, using Census Bureau population estimates and employment data from the Bureau of Labor Statistics:
The total U.S. population age 16 and over is at least 243 million. Subtracting the nearly 156 million Americans in the labor force in June 2013 -- that is, those who were either working or looking for work -- leaves 87 million Americans, which is close to 90 million.
However, the 90 million number is padded, since this number includes a lot of Americans who wouldn’t be expected to be working. Specifically:
• People age 16 to 17, who likely are in high school: 9 million
• People who are enrolled in either two- or four-year colleges: 21 million
• People age 65 and older, who have reached retirement age: 40 million people
That means 20 million people are of normal working age, not in college and not working. That’s less than one-quarter the amount repeatedly cited in the blogosphere.
So the 90 million number is exaggerated. Even so, the idea that fewer people are joining the workforce is something that worries economists.
All things being equal, economists like to see more people working because it helps economic growth (though not at the expense of dropping out of school, which can limit future employment opportunities and earnings potential).
To gauge these trends, economists can calculate the labor force participation rate, which is the percentage of the population that is either working or looking for work, and they can calculate the employment to population ratio, which is the percentage of the 16-and-over population that is currently employed. Both statistics generally track each other, but not in lockstep.
Here’s a summary of these statistics between the end of the last recession in June 2009 and the most recent month available, June 2013.
Statistic
June 2009
June 2013
Change
Employment level
142.2 million


144.1 million
+1.9 million
Civilian labor force
154.2 million
155.8 million
+1.6 million
Labor force participation rate
65.7 percent
63.5 percent
-2.2 percentage points
Employment to population ratio
60.6 percent
58.7 percent
-1.9 percentage points
So the number of people employed and the number joining the labor force have both increased since the end of the last recession -- but, importantly, these gains haven’t kept pace with the rise in population.
This decline actually started around 2000, but it intensified starting with the most recent recession.
"The trick is to determine how much of the drop represents the impact of a lagging economy, which is worrisome, and how much is due to non-worrisome factors, such as the aging of the adult population," Gary Burtless, an economist at the Brookings Institution, told PolitiFact earlier this year.
As more adults begin moving into retirement age, the percentage of Americans who work is bound to decline. And that’s been happening in a big way as the baby boomers age. Burtless has determined that the two employment ratios would have fallen in recent years just on the basis of aging, even if there had been no recession. But the age-related decline has been worsened by high unemployment rates during the recession.
Most troubling, economists say, is the decline among the core working ages of 25 to 55. In addition, the tight job market has convinced more people to opt out of the labor market, perhaps by becoming students or stay-at-home parents.
The key to describing the employment situation is to make sure you’re using the best possible statistics. "It’s important not to downplay the seriousness of the decline, while still getting the numbers right," said Tara Sinclair, a George Washington University economist.
Our ruling
Bloggers and pundits have said that 90 million Americans either aren’t working or aren’t looking for work. That’s a real number, but it includes high schoolers, college students and retirement-age Americans, leaving perhaps 20 million a better approximation. We rate the claim Mostly False.
Bureau of Labor Statistics, "Labor Force Statistics from the Current Population Survey," accessed July 29, 2013
Bureau of Labor Statistics, glossary, accessed July 30, 2013
U.S. Census Bureau, "Age and Sex Composition: 2010," May 2011
U.S. Census Bureau, "Age and Sex Composition in the United States: 2011," accessed July 30, 2012
National Center for Education Statistics, "Table 196. Enrollment, staff, and degrees/certificates conferred in postsecondary institutions participating in Title IV programs, by level and control of institution, sex of student, type of staff, and type of degree: Fall 2009 and 2009-10"
PolitiFact, "Rep. Cathy McMorris Rodgers says fewer now working than any point since 1979," April 12, 2013
Email interview with Tara Sinclair, economist at George Washington University, July 29, 2013


In a world of wild talk and fake news, help us stand up for the facts.