Our only agenda is to publish the truth so you can be an informed participant in democracy.
We need your help.
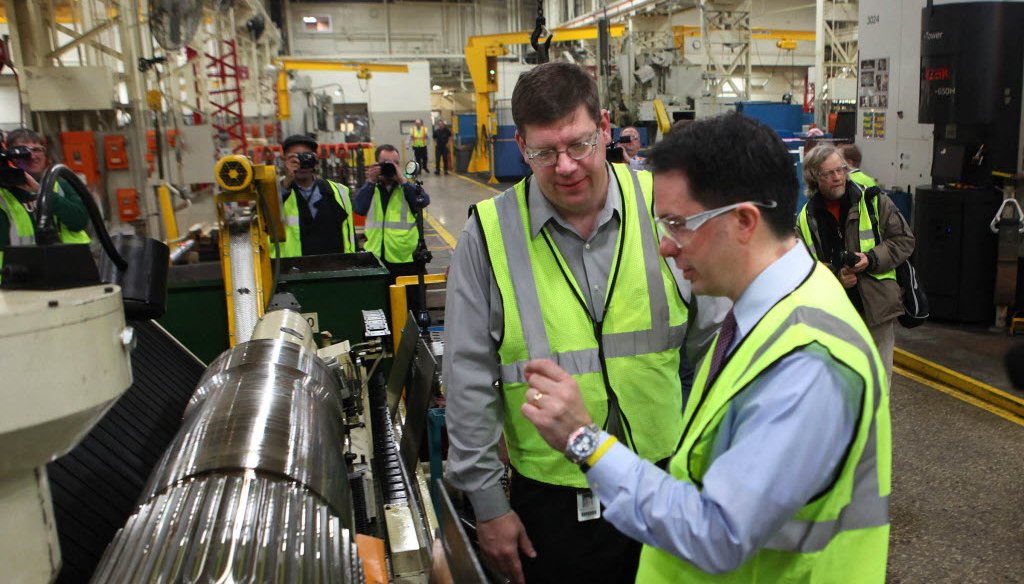
Gov. Scott Walker toured a mining equipment company in Milwaukee in 2012. (Milwaukee Journal Sentinel/Rick Wood)

A boast Gov. Scott Walker made in his weekly radio address on March 23, 2017 sounded like one he’ll repeat -- if he runs for re-election in 2018, which is widely expected.
After his standard, "Hi, Scott Walker here" greeting, the second-term Republican declared:
"Wisconsin’s economy is in the best shape it’s been since 2000."
It’s a bold, broad claim.
Is it right?
The measures
On the radio, Walker backed his claim with one of his favorite statistics -- the state’s unemployment rate. It had just dropped to 3.7 percent in February 2017, the lowest since November 2000.
Though important, the unemployment rate is but a single measure of the economy. When we asked for any other information to support the claim, his staff primarily cited declines in overall tax burden, income taxes and property taxes, saying "a competitive tax environment sets the stage for economic growth and simply allows households to keep more of their own money."
But taxes are more a measure of the health and size of government, not how well the economy is doing. Indeed, when we asked six Wisconsin economics professors for advice on how to evaluate Walker’s claim, none cited any tax-related measure.
With guidance from the experts and other sources, we settled on these six measures:
Unemployment rate
Labor participation rate
Average weekly wages
Average income for top earners vs rest of the population
Gross domestic product per capita
Poverty rate
We’ll address them two at a time.
Unemployment and employment
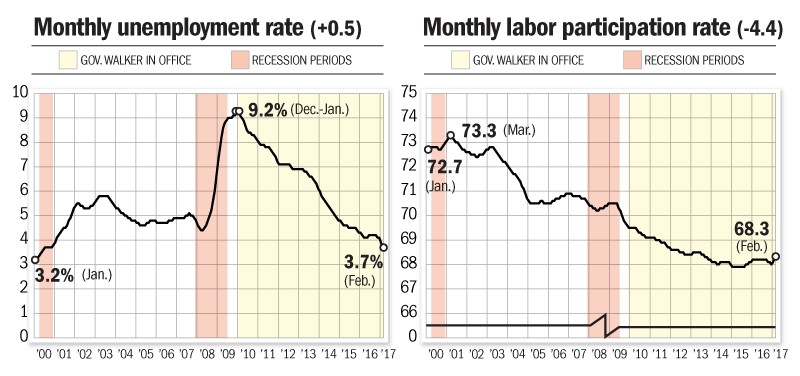
Unemployment rate: Percentage of people in the labor force -- the civilian population ages 16 and older -- who are unemployed.
Unemployment in Wisconsin was low in 2000 and it’s low again.
The rate generally rose from 2000 to 2003, then dipped from 2003 to 2008, before peaking at around 9 percent in the second half of 2009 and early 2010. Since, then has steadily declined.
Walker was correct in saying that the 3.7 percent rate in February 2017 was the lowest monthly rate since November 2000. (It was as low as 3.2 percent in January and February of 2000).
Labor participation rate: Percentage of the population that is either working or actively seeking work -- excluding people such as college students and retirees.
The labor participation rate is important because it takes into account people who are unemployed plus so-called discouraged workers -- those who are unemployed and not looking for work.
The figures show labor participation in Wisconsin is declining.
During 2000 and into 2001, the rate generally rose a bit, hitting 73.3 percent in March 2001.


But since then, it’s been on a downward slope, hitting 68.3 percent in February 2017. That means fewer people are in the workforce.
The takeaway: Unemployment backs Walker’s claim; labor participation does not.
Wages and income
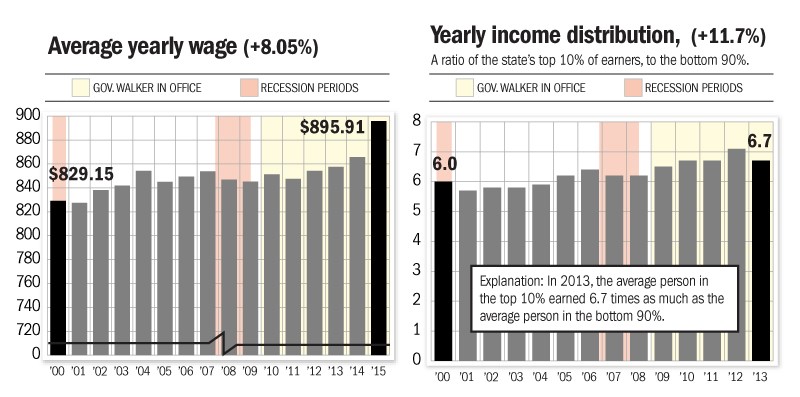
Real average weekly wage: What a person (in the private sector) is paid for working, adjusted for inflation, including not only regular wages but pay such as bonuses.
Wages in Wisconsin have generally been on an upward trend.
The figures are reported quarterly, but since they tend to vary by season (summer vs winter, for example), we looked at annual numbers.
On that basis, the average weekly wage rose from 2000 to 2004, and then rose and fell until 2011. Since then it’s been on the rise, hitting $896 in 2015, the last year for which annual data are available. That’s higher than any year going back to 2000.
Income distribution: How much more income is earned by people near the top of the scale versus the rest of the population. Income includes not only wages, but also money from sources such as investments and welfare benefits.
In Wisconsin, the gap between people near the top of the income scale and the rest of the population is growing.
We compared the average income of a person in the top 10 percent versus a person in the bottom 90 percent -- in other words, people near the top versus the rest of the population, taking inflation into account.
In 2013, the latest data available for this comparison, the annual income for the average person in the top 10 percent was $234,916. That’s 6.7 times more than the average income in the bottom 90 percent, which was $35,102. That ratio has generally increased since 2000, when it was 6.0.
The takeaway: Average wages back Walker’s claim, since they’re up; but income distribution doesn’t, given that the gap is growing between the relatively few people on the top end of the scale and everyone else.
Productivity and poverty
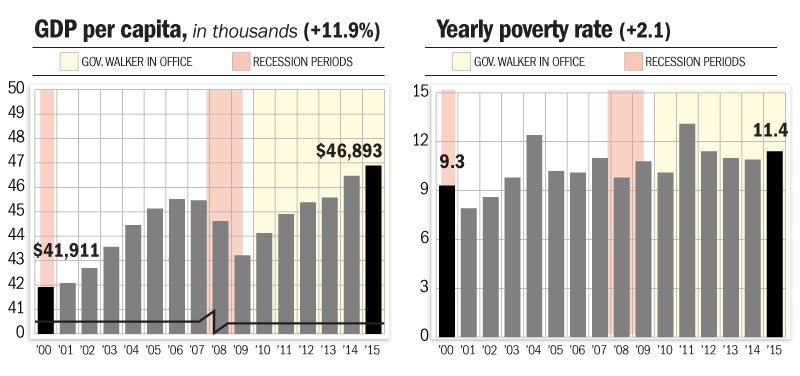
Real GDP per capita: Total value of goods and services produced, divided by the population and adjusted for inflation.
Gross domestic product per person in Wisconsin, taking into account inflation, rose from 2000 to 2006, dropped from then until 2009, and has been on the rise since.
The latest figure, for 2015, showed real GDP at $46,893 per person -- higher than any previous year going back to 2000, when it was $41,911.
Poverty rate: Percentage of people below the official poverty threshold.
Poverty is calculated based on a person’s income from sources such as wages, Social Security and child support, as well as from "cash" government benefits such as public assistance and unemployment insurance. The poverty threshold for 2015, the most recent year available for this comparison, was $12,082 for a single person and $24,257 for a family of four.
In Wisconsin, the poverty rate has trended upward.
The 2015 rate was 11.4 percent. That’s higher than every year going back 2000 except for two (12.4 percent in 2004 and 13.1 percent in 2011).
The takeaway: GDP helps Walker’s claim; poverty does not.
Summing up
As we’ve noted in previous fact checks, governors have some impact on a state’s economy, but many other factors, including national trends, are at work. In this instance, Walker didn’t explicitly take credit for what he says is a better economy, though he implies it.
The economists we consulted see some improvements and some declines in how Wisconsin’s economy is now compared to 2000.
"The economic portrait of Wisconsin since 2000 is mixed at best," said Lawrence University’s Merton Finkler. "Clearly, the Wisconsin economy is not as dynamic as some others, such as Minnesota's. Part of the reason is that it has done a relatively poor job of encouraging startup enterprises, which tend to grow employment faster than larger and older firms."
Said Andrew Reschovsky at the University of Wisconsin-Madison:
"A growing economy is characterized by rising real per capita GDP and rising real wages. This growth is to be expected, and reflects increased labor productivity over time. Although Wisconsin’s economy is larger now than it was in 2000, the fact that the poverty rate is higher and that there is growing income inequality indicates that the benefits of our growing economy have gone mainly to those with the highest incomes."
Our rating
Walker said: "Wisconsin’s economy is in the best shape it’s been since 2000."
The latest figures for the unemployment rate, wages and gross domestic product support Walker’s claim. But the figures for labor participation rate, income and poverty do not.
For a statement that is partially accurate, our rating is Half True.
Gov. Scott Walker, radio address, March 23, 2017
Email, Wisconsin Department of Revenue communications director Casey Langan, March 29, 2017
Email, University of Wisconsin-Madison professor emeritus of public affairs and applied economics Andrew Reschovsky, March 29, 2017
Email, University of Wisconsin-Milwaukee economics associate professor Kundan Kishor, March 28, 2017
Email, University of Wisconsin-Milwaukee distinguished economics professor John Heywood, March 28, 2017
Email, Marquette University economics professor Abdur Chowdhury, March 28, 2017
Email, Lawrence University John R. Kimberly distinguished emeritus professor of cconomics Merton Finkler, March 29, 2017
University of Wisconsin-Madison Kenneth J. Arrow professor of economics Steven Durlauf, March 28, 2017
Unemployment rate: Bureau of Labor Statistics, Local Area Unemployment Statistics, 2000-2017
Labor force participation rate: Bureau of Labor Statistics, Local Area Unemployment Statistics, 2000-2017
Real average weekly wage: Bureau of Labor Statistics, Quarterly Census of Employment and Wage and Consumer Price Index
Real GDP per capita: Bureau of Economic Analysis, Regional Economic Accounts, 2000-2015
Poverty rate: U.S. Census Bureau, Current Population Survey, 2000-2015
Average income of bottom 90% and top 10%: Economic Policy Institute, "Income inequality in the U.S. by state, metropolitan area, and county," 2016. Follows methodology from "Income Inequality in the United States, 1913-1998" by Thomas Piketty and Emmanuel Saez, 2003


In a world of wild talk and fake news, help us stand up for the facts.


 Politifact Rating: