
The departments of Commerce, Education and Energy and the EPA saw their spending increase by between 130 percent and 219 percent between 2008 and 2010.


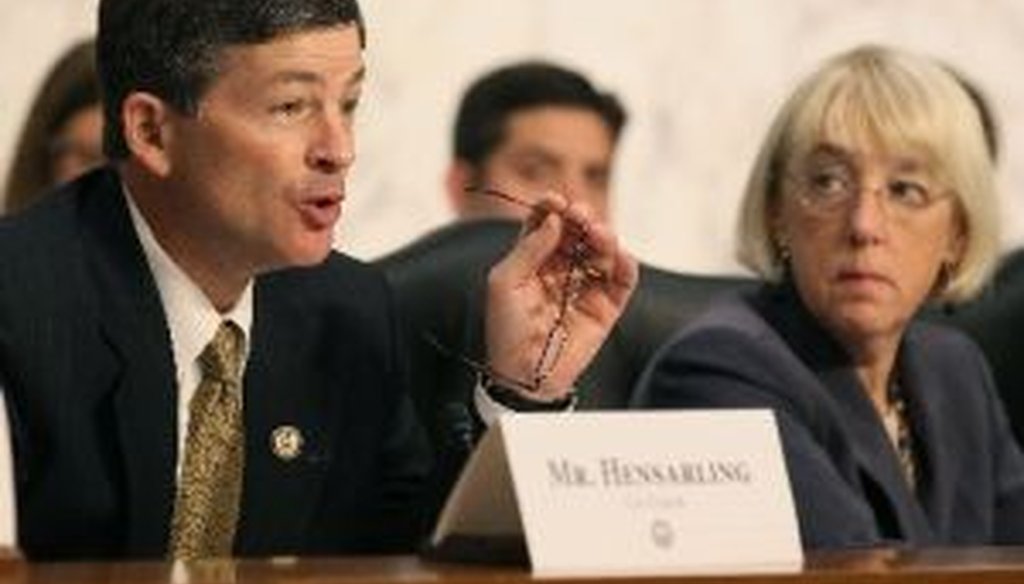
Rep. Jeb Hensarling, R-Texas (left) co-chairs the so-called Supercommittee that's charged with finding $1.5 trillion in deficit reduction by Thanksgiving. His co-chair is Sen. Patty Murray, D-Wash. (right).

Editor’s note: We originally published a ruling on this claim on Oct. 27, 2011, rating it False. After the story came out, Hensarling’s office -- which hadn’t gotten back to us by publication time -- contacted us to provide the data they were working from, and we promised to re-evaluate the claim based on the newly provided data. We’ve rewritten the article below, republishing it Oct. 28, keeping the rating the same. Our original article is archived here.
***
During an Oct. 26, 2011, hearing of the congressional Joint Select Committee on Deficit Reduction -- the "supercommittee" that’s charged with making steep cuts in the federal budget -- the co-chairman, Rep. Jeb Hensarling, R-Texas, offered budgetary statistics designed to show massive spending increases by federal agencies in recent years.
Here’s a portion of the back-and-forth between Hensarling and Douglas Elmendorf, director of the Congressional Budget Office, the nonpartisan arm of Congress that analyzes budget and fiscal matters.
Hensarling: "Is it not true that the stimulus bill, with interest, amounts to over a $1 trillion of spending, which accounts for a large temporary growth in our discretionary budget?"
Elmendorf: "Yes, although, as you know, congressman, only a part of the Recovery Act was about discretionary spending. There were also increases in mandatory spending and reductions in taxes. In total we put it a little over $800 billion, and including interest I think you're right about a trillion. And it did lead to a bulge in discretionary funding and then to … an attenuated bulge in outlays because not all of the money got spent right away."
Hensarling: "I don't know if you have at your fingertips numbers with respect to agency growth. I had quoted a few, and now that I look down, apparently the source is your office, so I hope I'm quoting your office correctly."
Elmendorf: "I don't have those at hand, congressman, but ... if they're numbers from us, then you can certainly trust those!" (Laughter in the hearing room.)
Hensarling: "I can trust them. Well, then I trust that when you add in the stimulus, the Commerce Department has grown 219 percent from '08 to '10, that with the stimulus, EPA has grown 130.8 percent. The Energy Department has grown 170.7 percent with the stimulus. Education has grown 180.6 percent at a time when the economy has actually seen negative economic growth and family paychecks have shrunk."
When this exchange got picked up in a Fox News Web article, a reader saw it and asked us whether Hensarling’s numbers were accurate. So we took a look.
After we published our original analysis of this comment on Oct. 27, 2011, Hensarling’s staff got back to us, sending the table he was working from as he conducted the exchange with Elmendorf. The table is drawn from CBO data but compiled by the House Budget Committee Republican staff.
It shows department-by-department breakdowns of discretionary budget authority between 2008 and 2011. What does "discretionary budget authority" mean? Simply put, it’s the amount of money that Congress, in a given year, has agreed to allow a department to spend -- but it may be spread over multiple years. It’s not the same as actually spending the money in that year. The latter is known as "outlays" -- a distinction that becomes important to our analysis. But to keep things simple, we’ll just look at discretionary budget authority for now.
Here’s a stripped-down version of Hensarling’s table; the full version is accessible here. All amounts are rounded and in billions of dollars.
As Hensarling stated at the hearing, he was adding together the 2010 authority and the stimulus amount to arrive at his percentage increase. And using that method, the numbers do work out. But is it a fair method to use? We have a few problems with it.
Hensarling combines several years of stimulus spending into a single year, exaggerating the actual amount of budgetary growth between 2008 and 2010.
Lumping all of the budget authority from the stimulus into one year makes the final year of his two-year comparison higher, even if the stimulus money was actually spent over multiple years. This juices the percentage increases he cited at the hearing.
As we noted, there’s a difference between a department being granted discretionary budget authority in a given year and actually spending the money in that year. Not only may the agency face logistical hurdles in spending the money, but in some cases the money was never expected, or intended, to be spent during the same year the authority was granted.
That’s where the alternate concept of "outlays" comes in. Outlays measure how much money actually goes out the department’s door in a given year. Here are the OMB outlay figures for 2008 to 2010.
Commerce: Up 71 percent (compared to Hensarling’s 219 percent)
Education: Up 41 percent (compared to Hensarling’s 181 percent)
Energy: Up 44 percent (compared to Hensarling’s 171 percent)
EPA: Up 39 percent (compared to Hensarling’s 131 percent)
It’s clear that for every department cited, Hensarling’s percentage increase is three to four times higher than what the figure would be for actual outlays. Even if you consider both methodologies to be equally valid -- which we’re not convinced of -- Hensarling has essentially cherry-picked a much higher figure for the percentage increase that doesn't represent real spending.
Also, to be strictly accurate, the budget authority from the stimulus should have been assigned to the year the bill passed -- 2009 -- which would have lowered his numbers, not 2010, as Hensarling has chosen to do. The fluid nature of how stimulus monies began flowing make this issue somewhat complicated, but choosing to add it to 2010 is one additional factor that jacks up the amount of spending in the latter year of Hensarling’s comparison.
Hensarling leaves out that stimulus spending was always supposed to be temporary.
Hensarling is guilty of cherry-picking for another reason: The stimulus was designed to be temporary.
Someone hearing Hensarling’s figures might assume that the large increases he cited would continue into the future, when in fact departmental budgets were designed to return to a more historically "normal" level by 2011 and beyond.
This becomes apparent from the column in Hensarling’s own chart titled "base budget growth, 2008-2010." "Base budget growth" is the amount of growth to the department’s budget minus the stimulus. Its pattern is closer to the department’s long-term spending arc.
These numbers, while rising, are much more modest than the figures Hensarling cites -- an 11 percent increase for Education, a 10 percent increase for Energy and a 35 percent increase for EPA. (Commerce’s figure was significantly higher, but we’ll explain why in a moment.)
To be fair, focusing on base budget growth when there’s an elephant in the room -- the stimulus -- isn’t appropriate either. But we think the most accurate way to chart the growth in departmental spending is to show separately how much comes from base growth and how much comes from temporary stimulus. Yet Hensarling focused only on a combination of the two -- a much more dramatic number.
"It is a little disingenuous to infer the stimulus bulge as the baseline increase in agency budgets," said Steve Ellis, vice president of Taxpayers for Common Sense, an independent group that analyzes federal spending.
Ellis added that he’s heard Democrats doing the opposite. "You often find Democrats complaining about draconian cuts from 2009 to 2011, using the same bulge in the other direction," he said.
The Commerce Department figures are skewed by a different temporary bump -- from the 2010 Census.
Every 10 years, the Commerce Department undertakes a national census. As a result, spending by the department in any year divisible by 10 is much higher than it is for the rest of the decade. That skews the Commerce Department number for 2010 -- the final year of the time frame Hensarling cited, thus contributing to Commerce’s supposed chart-topping increase of 219 percent.
Aides speaking for Hensarling acknowledged the Census bump. They also addressed the other two concerns we listed above.
On why they used budget authority rather than outlays -- effectively lumping all stimulus spending into 2010 even if the money was spent in a different year -- Jonathan Burks, policy director at the House Budget Committee, said that Hensarling was speaking as a member of Congress, and Congress can only control how much budget authority is granted, not how fast departments ultimately spend the money they are permitted to spend.
As for why Hensarling used the stimulus-enhanced numbers for the 2010 figure, Burks acknowledged that "you can look at the numbers a lot of different ways, but the fair way to do it is to look at the amount of budgetary resources available to agencies during the first two years of Democratic control" of Congress and the White House.
He also expressed skepticism about how temporary the stimulus will ultimately prove to be. He said that the White House may have sold the stimulus as a temporary measure, but it’s now coming back with an American Jobs Act that looks a lot like a stimulus bill.
Our ruling
We understand the arguments behind Hensarling’s methodological choices, but we still believe the path he chose cherry-picked the highest possible increase that the numbers would allow -- one several times higher than other ways to measure the same figure.
He lumped all stimulus spending into a single year, even though the spending was spread over several years. The year he chose to assign the stimulus spending to -- 2010 -- was not even the year the budget authority had been granted. And he obscured the fact that much of the enormous increases he cited stemmed from temporary factors, whether it’s the stimulus or spending on the decennial Census. We rule this claim False.
Jeb Hensarling, comments at a hearing of the Joint Select Committee on Deficit Reduction, Oct. 26, 2011 (accessed via Nexis)
FoxNews.com, "Democrats Balk at Non-Defense Spending Cuts, Float Alternative Proposal to Super Committee," Oct. 26, 2011
Office of Management and Budget, "Table 4.1—Outlays by Agency: 1962–2016," accessed Oct. 27, 2011
Office of Management and Budget, "Table 5.4—Discretionary Budget Authority by Agency: 1976–2016," accessed Oct. 27, 2011
House Budget Committee, "Actions Speak Louder Than Words: A Record of Fiscal Recklessness Undermines Rhetoric of Fiscal Responsibility," July 15, 2011
E-mail interview with Steve Ellis, vice president of Taxpayers for Common Sense, Oct. 27-28, 2011
Interview with Jonathan Burks, policy director for the House Budget Committee, Oct. 28, 2011


In a world of wild talk and fake news, help us stand up for the facts.