Says Mitt Romney is wrong to claim that spending under Obama has "accelerated at a pace without precedent in recent history," because it's actually risen "slower than at any time in nearly 60 years."


Our only agenda is to publish the truth so you can be an informed participant in democracy.
We need your help.
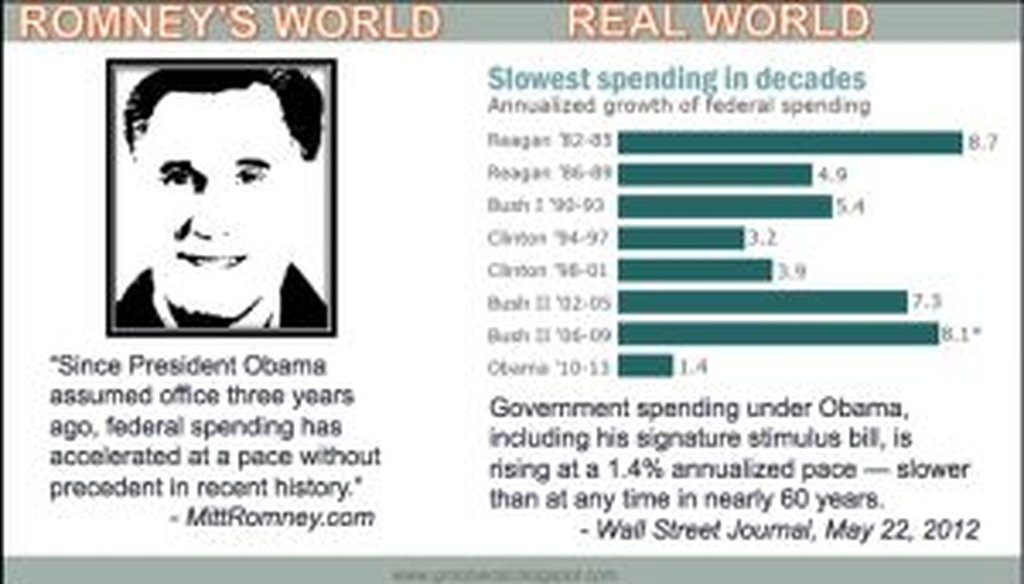
This graphic, summarizing an article in MarketWatch.com, caught fire in liberal social media circles almost immediately after the original story was posted. We checked its accuracy.

EDITOR'S NOTE: This item prompted a large volume and feedback and comments. We published an article about the comments on May 25 and an update to this item on May 31. You'll find the update below, at the end of the fact-check.
On May 22, 2012, Rex Nutting, the international commentary editor for the financial website MarketWatch, published a column titled, "Obama spending binge never happened." Nutting’s column explored data on federal spending patterns during recent presidencies, concluding that -- contrary to the tax-and-spend stereotype of Democrats -- President Barack Obama has actually presided over the smallest increases in federal spending of any recent president.
The column went viral. Within hours, people who liked the column were posting a graphic on Facebook that paired a line from Nutting’s column with a quote from Mitt Romney’s campaign website.
Under the heading, "Romney’s World," the Facebook post quoted a Romney Web page saying, "Since President Obama assumed office three years ago, federal spending has accelerated at a pace without precedent in recent history." (That accurately quotes Romney.)
Immediately to the right, under the heading, "Real World," the Facebook post provided a retort using a caption from Nutting’s key chart: "Government spending under Obama, including his signature stimulus bill, is rising at a 1.4 percent annualized pace — slower than at any time in nearly 60 years." (The post cited the quotation to the Wall Street Journal; technically, Nutting writes for MarketWatch, which is an affiliate of the Wall Street Journal.)
The Facebook post appears to have originated with the liberal blog Groobiecat Call, which promises "data-driven analysis" and "lefteous indignation." Before the day was out, roughly a dozen PolitiFact readers had forwarded it to us, seeking our view of its accuracy. So we looked into it.
Nutting’s column
First, let’s recap what Nutting said in his column:
"Almost everyone believes that Obama has presided over a massive increase in federal spending, an ‘inferno’ of spending that threatens our jobs, our businesses and our children’s future. Even Democrats seem to think it’s true. But it didn’t happen. Although there was a big stimulus bill under Obama, federal spending is rising at the slowest pace since Dwight Eisenhower brought the Korean War to an end in the 1950s."
Nutting ran the numbers for the past 60 years, adjusting for the fact that "the first year of every presidential term starts with a budget approved by the previous administration and Congress." For Obama, that means that "the 2009 fiscal year, which Republicans count as part of Obama’s legacy, began four months before Obama moved into the White House. The major spending decisions in the 2009 fiscal year were made by George W. Bush and the previous Congress."
He continued, "By no means did Obama try to reverse that spending. Indeed, his budget proposals called for even more spending in subsequent years. But the Congress (mostly Republicans but many Democrats, too) stopped him. If Obama had been a king who could impose his will, perhaps what the Republicans are saying about an Obama spending binge would be accurate."
Nutting did, however, attribute a portion of fiscal 2009 spending to Obama rather than Bush. He reassigned about $140 billion, covering spending made that year through the stimulus bill, the expansion of a children’s health-care program and other appropriations bills passed in the spring of 2009.
"If we attribute that $140 billion in stimulus to Obama and not to Bush," Nutting wrote, "we find that spending under Obama grew by about $200 billion over four years, amounting to a 1.4 percent annualized increase."
Our analysis
Before presenting our own calculations, we’ll get some methodological issues out of the way.
Like Nutting, we used historical data from the Office of Management and Budget along with projections from the nonpartisan Congressional Budget Office. Projecting outlays into the future involves a degree of uncertainty, but CBO’s most recent projections are considered the most independent and reliable.
Because we’re checking the Facebook post rather than Nutting’s column, we examined the way the post compared the presidents. Since the Facebook post ignores differences between presidents’ first and second terms, which are noted in Nutting’s chart, we’ve combined presidents’ entire tenures into a single time span. And several presidents who served during the past 60 years didn’t have tenures that coincided precisely with fiscal years, due to assassination or resignation. So we’re using the closest fiscal years we can, and we’re skipping President Gerald Ford, whose tenure was too short to adequately measure.
Here are the average spending increases per year in raw dollars (not adjusted for inflation) in descending order by president:
President
Fiscal year baseline
Last fiscal year
Average percentage increase per year
Carter 1977 1981 16.4 Nixon 1969 1975 13.5 Johnson 1964 1969 11.0 George W. Bush 2001 2009 10.2 Reagan 1981 1989 8.6 Kennedy 1961 1964 7.1 George H.W. Bush 1989 1993 5.8 Clinton 1993 2001 4.0 Eisenhower 1953 1961 3.6 Obama 2009 2013 1.4
So, using raw dollars, Obama did oversee the lowest annual increases in spending of any president in 60 years.
Here are the results using inflation-adjusted figures:
President
Fiscal year baseline
Last fiscal year
Average percentage increase per year
Johnson 1964 1969 6.3 George W. Bush 2001 2009 5.9 Kennedy 1961 1964 4.7 Carter 1977 1981 4.2 Nixon 1969 1975 3.0 Reagan 1981 1989 2.7 George H.W. Bush 1989 1993 1.8 Clinton 1993 2001 1.5 Obama 2009 2013 -0.1 Eisenhower 1953 1961 -0.5
So, using inflation-adjusted dollars, Obama had the second-lowest increase -- in fact, he actually presided over a decrease once inflation is taken into account.
Bottom line: The Facebook post’s claim that government spending under Obama is "slower than at any time in nearly 60 years" is very close to accurate.
Explaining the results
So why the disconnect between Obama’s image as a big spender and the reality of how much federal spending has actually grown?
First, Obama’s record on debt is a lot less flattering than is his record on federal government spending. During the same time that spending is poised to be increasing by 1.4 percent per year under Obama, the debt will be increasing by 14.6 percent per year. The reason? Year by year, federal revenues haven’t been keeping up with spending, due to the struggling national economy (which has held back tax revenues) and a continuation of tax cuts. And each year there’s an annual deficit, the national debt grows.
Second, federal spending under Obama is higher as a share of gross domestic product than it has been in most of the previous 60 years. That, too is because of the economy, which has simultaneously slowed the growth of GDP and boosted government spending for programs such as food stamps and Medicaid.
Third, the aging of the baby boomers has driven a rise in entitlement spending that is masking cuts Obama and the GOP Congress have made, and have promised to make, in discretionary spending. Using outlays as the unit of measurement, as Nutting and the Facebook post have done, means focusing on money already spent. It does not take into account future spending that’s been committed to but not yet carried out.
And finally, many Americans associate Obama with the high-profile legislative activities of his first year or two, when initiatives such as the stimulus sent spending upward the fastest. Since then, spending has slowed, thanks in part to spending cuts pushed by congressional Republicans.
Which brings us to another important issue: The president is not all-powerful, so his record on spending was accomplished in collaboration with congressional Republicans.
Our ruling
The Facebook post says Mitt Romney is wrong to claim that spending under Obama has "accelerated at a pace without precedent in recent history," because it's actually risen "slower than at any time in nearly 60 years."
Obama has indeed presided over the slowest growth in spending of any president using raw dollars, and it was the second-slowest if you adjust for inflation. The math simultaneously backs up Nutting’s calculations and demolishes Romney’s contention. The only significant shortcoming of the graphic is that it fails to note that some of the restraint in spending was fueled by demands from congressional Republicans. On balance, we rate the claim Mostly True.
UPDATE, May 31, 2012
While we have already shared some of the critiques of this fact-check in a previous follow-up story, critics have since noted that two of our fellow fact checkers -- the Washington Post Fact Checker and the Associated Press -- offered more negative rulings on related claims.
The Fact Checker addressed the apparent discrepancy succinctly in a follow-up column, saying "we did not evaluate the same thing."
There’s a widespread misconception that we gave a Mostly True rating to Rex Nutting’s MarketWatch column. After our original fact-check published, White House spokesman Jay Carney tweeted, "PolitiFact backs MarketWatch analysis of federal spending under POTUS & predecessors." Many conservative bloggers read our fact-check the same way, as they attacked us.
The assumption made by both sides is wrong. We examined at a Facebook post that said Mitt Romney is wrong to claim that spending under Obama has "accelerated at a pace without precedent in recent history," because it's actually risen "slower than at any time in nearly 60 years." The Facebook post does rely partly on Nutting’s work, and our item addresses that, but we did not simply give our seal of approval to everything Nutting wrote. In fact, half of the Facebook post stems from something else entirely -- a claim on Mitt Romney’s website.
Using and slightly tweaking Nutting’s methodology, we recalculated spending increases under each president back to Dwight Eisenhower and produced tables ranking the presidents from highest spenders to lowest spenders. By contrast, both the Fact Checker and the AP zeroed in on one narrower (and admittedly crucial) data point -- how to divide the responsibility between George W. Bush and Obama for the spending that occurred in fiscal year 2009, when spending rose fastest.
How you divide the spending between Bush and Obama for fiscal 2009 only makes a difference to our ruling if the shifts move Obama significantly up or down our rankings. Do they?
Nutting attributed spending from the first year of every presidential term to the previous administration, arguing that every new president starts their term four months into a fiscal year begun under their predecessor. Historically, this has not been a particularly controversial approach, and even some of Nutting’s critics we spoke to agreed that it’s not a bad rule of thumb.
But fiscal year 2009 was special because it came amid an economic and financial free fall that drove the nation’s leaders to spend a lot more than they ordinarily would. Nutting did take these factors into account, but not to the extent that some critics think is needed. Nutting shifted $140 billion in fiscal 2009 spending from two of Obama’s signature programs -- the economic stimulus package and an expansion of the Children’s Health Insurance Program -- out of Bush’s column and into Obama’s. He also shifted excess spending beyond what Bush would have spent from the appropriations bills signed by Obama in 2009.
A number of critics also argued that spending for the Troubled Asset Relief Program should be taken into account. This program aided troubled financial institutions and involved a lot of money going out the door in fiscal 2009 and a lot of money coming in the door in subsequent years as the money was paid back to the treasury. The critics note that counting the TARP expenses as Bush’s artificially raises the baseline level of spending Obama inherited, thereby making Obama’s subsequent spending increases seem unrealistically small.
We think reasonable people can disagree on which president should be responsible for TARP spending, but to give the critics their say, we’ll include it in our alternative calculation. So, combining the fiscal 2009 costs for programs that are either clearly or arguably Obama’s -- the stimulus, the CHIP expansion, the incremental increase in appropriations over Bush’s level and TARP -- produces a shift from Bush to Obama of between $307 billion and $456 billion, based on the most reasonable estimates we’ve seen critics offer.
That’s quite a bit larger than Nutting’s $140 billion, but by our calculations, it would only raise Obama’s average annual spending increase from 1.4 percent to somewhere between 3.4 percent and 4.9 percent. That would place Obama either second from the bottom or third from the bottom out of the 10 presidents we rated, rather than last.
When we encounter a compound claim such as this one, we consider the accuracy of each part separately. During our internal discussions, we give a preliminary rating to each half of a claim, then average them to produce our final, published rating.
Our extensive consultations with budget analysts since our item was published convinces us that there’s no single "correct" way to divvy up fiscal 2009 spending, only a variety of plausible calculations. So the second portion of the Facebook claim -- that Obama’s spending has risen "slower than at any time in nearly 60 years" -- strikes us as Half True.
Meanwhile, we would’ve given a True rating to the Facebook claim that Romney is wrong to say that spending under Obama has "accelerated at a pace without precedent in recent history." Even using the higher of the alternative measurements, at least seven presidents had a higher average annual increases in spending. That balances out to our final rating of Mostly True.
Facebook post, originating at Groobiecat Call, accessed May 22, 2012
MarketWatch, "Obama spending binge never happened" (column by Rex Nutting), May 22, 2012
Mitt Romney for President, issues web page on spending, accessed May 23, 2012
Office of Management and Budget, Table 1.1—Summary of Receipts, Outlays, and Surpluses or Deficits (-): 1789–2017, accessed May 23, 2012
Office of Management and Budget, Table 1.3—Summary of Receipts, Outlays, and Surpluses or Deficits (-) in Current Dollars, Constant (FY 2005) Dollars, and as Percentages of GDP: 1940–2017, accessed May 23, 2012
Office of Management and Budget, Table 7.1—Federal Debt at the End of Year: 1940–2017, accessed May 23, 2012
Congressional Budget Office, "The Budget and Economic Outlook: Fiscal Years 2012 to 2022," January 2012
Bureau of Labor Statistics, inflation calculator, accessed May 23, 2012
E-mail interview with Roy T. Meyers, political scientist at the University of Maryland (Baltimore County), May 23, 2012
E-mail interview with Steve Ellis, vice president of Taxpayers for Common Sense, May 23, 2012
Interview with Rex Nutting, MarketWatch columnist, May 22, 2012


In a world of wild talk and fake news, help us stand up for the facts.