The number of people who have died in the U.S. in 2020 is on par with years prior to COVID-19.


Our only agenda is to publish the truth so you can be an informed participant in democracy.
We need your help.

A chart that compares annual U.S. death tolls using CDC data is incomplete. It doesn’t accurately represent the number of deaths in the country in 2020.
The health agency has reported that an estimated 198,081 excess deaths between late January and early October 2020 in the U.S. are attributable to the virus.
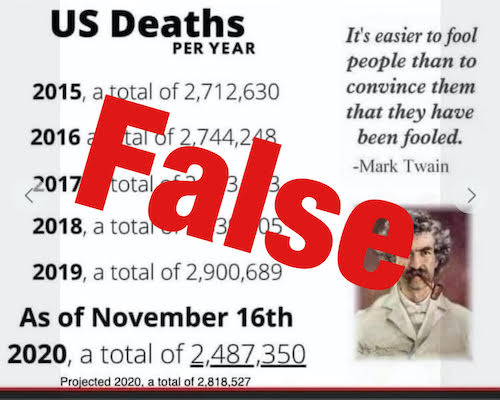
Posts on social media are attempting to downplay the impact of the COVID-19 pandemic using a chart that shows that the 2020 U.S. death toll hasn’t changed much from previous years.
The chart, titled "US deaths per year," displays figures comparing deaths in the country for the last five years, ranging from just over 2.7 million in 2015 to 2.9 million in 2019. It says the toll for 2020, as of Nov. 16, is "2,487,350." Some versions also include a whole-year projection of 2,818,527.
"People died before Covid. Amazingly the death rate hasn’t changed. How can that be with such a deadly virus????" one user wrote.
But the comparison is flawed for a few reasons. The 2020 statistics cited are not the final figures, and the Centers of Disease Control and Prevention has estimated that hundreds of thousands of excess American deaths are attributed to the virus this year. Lastly, it ignores that COVID-19 has killed over 290,000 Americans to-date, the highest virus death toll in the world.
The post was flagged as part of Facebook’s efforts to combat false news and misinformation on its News Feed. (Read more about our partnership with Facebook.)
The numbers listed from 2015 through 2018 are legitimate and come from the CDC. The health agency reported 2,712,630 deaths in the U.S. in 2015, 2,744,248 in 2016, 2,813,503 in 2017, and 2,839,205 in 2018.
While the final numbers for 2019 have not been released, the CDC’s provisional count for the year — 2,855,000 — comes close to the chart’s 2,900,689 figure, though it’s not clear how they reached the number.
The chart’s 2,487,350 figure leading up to the week of Nov. 16, 2020, reflects CDC data, but it’s not a complete depiction of how many Americans died in 2020.
Not only does the figure not account for the final six weeks of the year, it doesn’t represent the first few weeks, either. The weekly provisional deaths table doesn’t begin until the week ending Feb. 1, 2020. What’s more, these numbers are continuously updated due to reporting lags, which the CDC says can range from one week to eight weeks or more, depending on the jurisdiction and cause of death.
The provisional tally for the year, as of Dec. 11, has already gone up to 2,728,104.
Meanwhile, in another report, the CDC estimated that COVID-19 has caused almost 200,000 excess deaths in the U.S. from late January through early October. Excess deaths are defined in the report as the number of persons who have died from all causes, in excess of the expected number of deaths for a given place and time.
"Overall, an estimated 299,028 excess deaths occurred from late January through October 3, 2020, with 198,081 (66%) excess deaths attributed to COVID-19," the agency reported.
Lauren Rossen, a data scientist with CDC’s National Center for Health Statistics, told PolitiFact that the numbers of deaths in 2020 are "without a question NOT on par with previous years" and that claims that the numbers are equivalent are based on misinterpretations and misuse of the available data.
Since we don’t have all the data for 2020, Rossen said a more accurate analysis would need to involve comparing the number of deaths that occurred in the first 44 weeks, or so, of the year with the number of deaths that occurred over those same weeks in previous years.
"Looking at the number of deaths each year through week 44 (the most recent weeks are incomplete in 2020 due to the length of time it takes to receive and tabulate death certificates), we can see the totals over the same time periods each year. There have been nearly 317,000 more deaths in 2020 than in the same time period of 2019," Rossen said.
A chart circulating online claims to demonstrate that the annual U.S. death toll has not changed significantly in 2020 amid COVID-19.
This is wrong and ignores that the virus has killed more than 290,000 Americans to-date, the most in any country in the world.
The data used for 2019 is not final and the figures presented for 2020 are incomplete. Other CDC data also refutes the claim’s premise, with an estimation of hundreds of thousands of excess American deaths attributed to the virus this year.
False.
Facebook post, Dec. 9, 2020
Facebook post, Nov. 23, 2020
Centers for Disease Control and Prevention, Excess Deaths Associated with COVID-19, by Age and Race and Ethnicity — United States, January 26–October 3, 2020, Oct. 23, 2020
Centers for Disease Control and Prevention, State and National Provisional Counts, Accessed Dec. 11, 2020
Centers for Disease Control and Prevention, Daily Updates of Totals by Week and State, Accessed Dec. 11, 2020
AFP Fact Check, Online posts minimize Covid-19’s deadly impact in US, Dec. 8, 2020
Reuters, Fact check: Chart does not present accurate US deaths figure for 2020, Nov. 27, 2020
Email interview, Lauren Rossen, data scientist with CDC’s National Center for Health Statistics (NCHS), Dec. 11, 2020


In a world of wild talk and fake news, help us stand up for the facts.