
"Nine out of the 10 poorest states are Red states."


Our only agenda is to publish the truth so you can be an informed participant in democracy.
We need your help.
Facebook post by Occupy Democrats

Editor's note: On Jan. 12, 2014, we rated this statement as True. We decided to re-rate our item after considering an additional poverty ranking that incorporates factors such as housing costs from state to state. The original item can be found here.
The partisan blogosphere is filled with arguments over whether liberal or conservative policies are better for states. No matter what is proposed -- cutting the sales tax, raising the minimum wage, etc. -- someone can always come up with a state to cite as an example of why it's a good (or bad) idea.
But we were struck by this claim posted by the pro-Democrat group Occupy Democrats on Facebook:
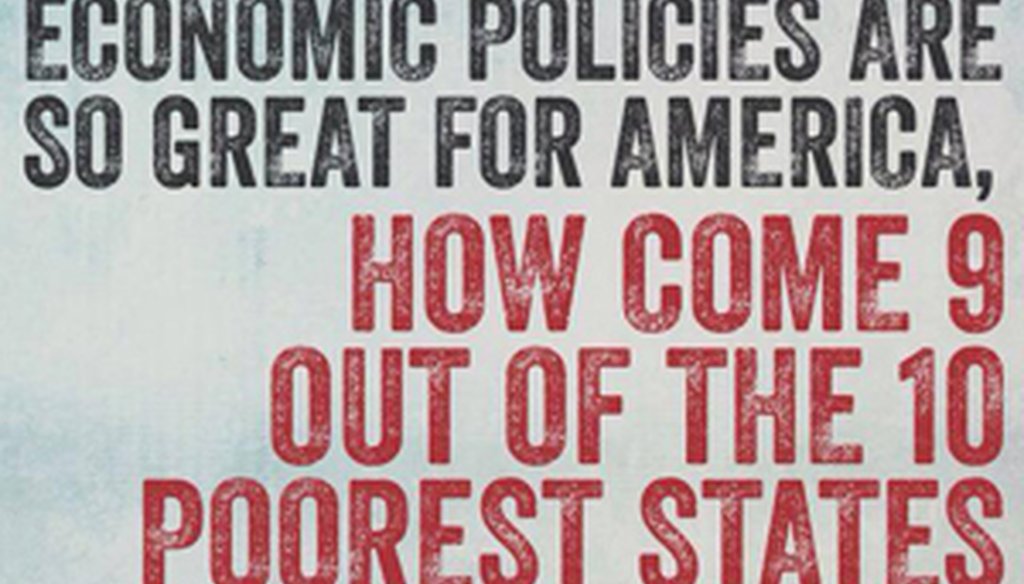
"If Republican economic policies are so great for America, how come 9 out of the 10 poorest states are Red states?"
We're not going to rule on the cause-and-effect question posed by the posting. Yet because Red states have a reputation for being more business-friendly, and because many argue that pro-business policies lead to better lives for everyone, we wondered whether the Occupy Democrats' claim was correct.
When we emailed Occupy Democrats, founder Omar Rivero sent us links to several sources including a sortable Wikipedia table based on the 2010 U.S. Census, along with more recent data from the U.S. Department of Commerce Bureau of Economic Analysis. We also did our own search of the U.S. Census database.
We’ll start with the standard definition of a Red state.
At PolitiFact Rhode Island, we recognize that whether a state is Red or Blue can be a matter for debate. Our state is considered to be among the bluest of the Blue, yet it has had Democratic governors in only 20 of the last 50 years. Nonetheless, the color is typically defined by how a state votes in the presidential elections, so we're going to classify states by how they voted in the 2012 Obama-Romney race.
It should be noted that there are different ways to measure poverty. Occupy Democrats says its claim is based on per-person income. We looked at that, along with median household income and median family income.
By all three measures, 9 out of the 10 poorest states voted Republican in the last presidential election. (In fact, they voted Red in the last four elections.)
According to the latest Census data, 9 of the 10 states with the lowest per-person income levels were Red: Mississippi, Arkansas, Idaho, West Virginia, Kentucky, Utah, Alabama, South Carolina and Oklahoma.
The Census data also show that 9 of the 10 states with the lowest median household income were Red: Mississippi, Arkansas, West Virginia, Kentucky, Alabama, Tennessee, Louisiana, South Carolina and Oklahoma.
And 9 of the 10 states with the lowest median family income were Red: Mississippi, Arkansas, West Virginia, Kentucky, Alabama, Tennessee, Oklahoma, Louisiana and South Carolina.
The only Blue state on each list: New Mexico.
By the way, 9 of the 10 states with the highest per-person income voted Blue in the 2012 presidential race: Colorado, Connecticut, Maryland, New Jersey, Massachusetts, New Hampshire, New York, Virginia and Washington. The only Red state on the list: Alaska.
It could also be argued that state-by-state costs of living should be taken into account when considering which states are poorest. Unfortunately, the federal government doesn't do its cost of living calculations by state.
However, the Census Bureau's "supplemental poverty measure" tries to adjust for some of the geographical cost differences. So while, under the bureau's standard poverty measure nine of the 10 poorest states are Red, the latest Supplemental Poverty Measure changes that ranking significantly.
Mississippi, New Mexico, South Carolina, Kentucky and Tennessee fall from the list, replaced by California (the poorest), Nevada, Florida, New York, and Hawaii, which were all Blue states in the 2012 race. (Arizona, Arkansas, Georgia, Louisiana and Texas -- all Red states -- make the list either way.)
The supplemental measurement adjusts for local variations in the cost of housing, which is not considered by the standard poverty measure, said Kathleen Short, an economist with the Census Bureau.
But there's a twist. It also counts a family's government assistance -- such as food stamps, housing assistance and tax credits for the poor -- as income, further complicating the matter.
Housing costs are the biggest factor that move states in the ranking, she said. In addition, states where a lot of poor people are getting government assistance may look less poor in the supplemental ranking.
Ultimately, each measure of the poorest states has its drawbacks. But the supplemental poverty measure offers a reason to temper the evidence from traditional measures that demonstrate the statement to be True. For that reason, we rule the "9 in 10" claim Mostly True.
(If you have a claim you’d like PolitiFact Rhode Island to check, email us at [email protected]. And follow us on Twitter: @politifactri.)
Facebook.com, "Occupy Democrats's Page," Dec. 26, 2013, accessed Jan. 2, 2014
Email, Omar Rivero, founder, Occupy Democrats, Jan. 3, 2014
Wikipedia.org, "List of U.S. states by income," "Red states and blue states," "List of current United States governors," "List of United States state legislatures," "United States presidential election, 2012," all accessed Jan. 2-10, 2014
BBER.UMN.edu, "Per Capita Personal Income by State," Bureau of Business & Economic Research, University of New Mexico, April 2, 2013, accessed Jan. 8, 2014
FactFinder2.Census.gov, "Median Household Income (In 2012 Inflation-Adjusted Dollars)" and "Per Capita Income in the Past 12 Months (in 2011 Inflation-Adjusted Dollars)," U.S. Census Bureau, accessed Jan. 9, 2014
Census.gov, "The Research Supplemental Poverty Measure: 2012," Current Population Reports, November 2013, accessed Jan. 29, 2014
Interview and email, Kathleen Short, economist, U.S. Census Bureau, Feb. 4 and 14, 2014


In a world of wild talk and fake news, help us stand up for the facts.