
"Do you know which state has the worst ratio of white voter turnout to African-American voter turnout? Massachusetts. Do you know what has the best, where African-American turnout actually exceeds white turnout? Mississippi."


Our only agenda is to publish the truth so you can be an informed participant in democracy.
We need your help.
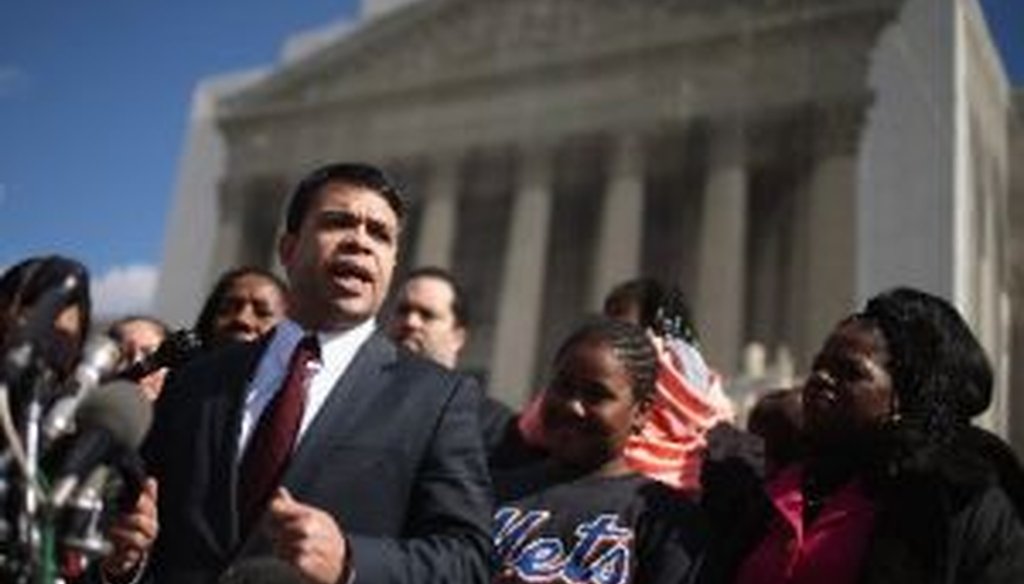
NAACP Legal Defense and Educational Fund attorney Debo Adegbile talks to reporters outside the U.S. Supreme Court on Feb. 27, 2013, when he argued in the case Shelby County v. Holder, a legal challenge to a portion of the Voting Rights Act.

Chief Justice John Roberts quizzed -- and stumped -- U.S. Solicitor General Donald Verrilli Jr. on some deep-in-the-weeds voting statistics during a recent oral argument at the Supreme Court.
The comments came during a challenge to a key provision of the Voting Rights Act, the landmark 1965 law that ensured members of racial minorities the right to vote.
In the case before the court, Shelby County, Ala., challenged how the Voting Rights Act determines whether a state or locality needs advance approval from the U.S. Justice Department before it changes any voting laws, regulations or procedures.
The law requires advance approval for Alabama, as well as for five other southern states (Georgia, Louisiana, Mississippi, South Carolina and Virginia) that demonstrated a poor historical record of allowing minorities to vote. Three other states (Alaska, Arizona and Texas) plus a variety of local jurisdictions are also subject to "preclearance." Shelby County argued that these requirements are outdated.
At one point in the oral argument held Feb. 27, 2013, Roberts asked Verrilli, "Do you know which state has the worst ratio of white voter turnout to African-American voter turnout?"
Verrilli, who was defending the law as currently written, responded, "I do not."
Roberts said, "Massachusetts. Do you know what has the best, where African-American turnout actually exceeds white turnout? Mississippi."
Roberts was pointing out a striking irony -- that Massachusetts, a state well known for its liberalism, was seemingly a poor performer in protecting minority voting rights, yet Mississippi, a state for which the Voting Rights Act demands intensive federal scrutiny, actually seems to be a model of voting equality.
It would be a powerful argument for changing the law, but the comparison quickly drew criticism, including from Massachusetts Secretary of the Commonwealth William Galvin. We wondered, does the chief justice have his numbers right? And if so, do they support his point? We looked at the data and checked with a variety of experts.
We should note that the Supreme Court has declined to elaborate on Roberts’ data selection, but there is wide agreement among voting experts that he was using data from the Current Population Survey, a widely used U.S. Census Bureau survey. The survey provides data on registration and voting on a state-by-state and race-by-race basis every two years. The experts came to this conclusion because there don’t appear to be any other data sources that provide the information Roberts cited.
George Mason University political scientist Michael McDonald, who filed an amicus (or friend-of-the-court) brief supporting the current law, told PolitiFact that he believes Roberts was basing his comment on 2004 Current Population Survey data, since that year’s findings had been cited in a previous lower-court dissent in the Shelby County case. However, since Roberts didn’t specify a year during oral arguments -- and since he used the present tense -- we think a reasonable listener would assume that the chief justice is referring to the most recent data available. So we will focus on data for 2008 (the last presidential election year available) and for 2010 (the last midterm election year available).
In a moment, we’ll begin by looking at some of the problems with using Current Population Survey data to back up Roberts’ claim. After that, we’ll grant for the sake of argument that the Current Population Survey is valid for this purpose and look instead at why Roberts’ interpretation of the data is less than ideal. Finally, we’ll discuss why, despite these problems, Roberts has a reasonable point to make.
Why the Current Population Survey isn’t a good source of backup on Roberts’ point
• The survey has large margins of error for black populations. Generally speaking, any survey that collects data from a relatively small group of people will have a larger margin of error than a survey that collects data from a larger group of people. So when the Current Population Survey looks at Massachusetts, the margin of error for the figures relating to the entire state population are fairly small, but the margin of error for figures relating to the state’s African-American population (which accounts for just 6 percent of adults in the state) is bigger. With a smaller pool of African-Americans responding to the survey, there’s simply a bigger chance that a few bits of off-base data will skew the whole sample.
This appears to be what happened with Massachusetts (as well as with other states that have relatively small black populations). The survey found that in Massachusetts, 52 percent of all adult citizens voted in 2010, with a margin of error of about two percentage points. But the same survey found that 39 percent of black voters in Massachusetts voted in the same year, with a much larger margin of error of 11 points. This means the black voting rate actually may have been as high as 50 percent -- pretty close to the percentage for the state as a whole.
• The survey shows some perplexing year-to-year changes. You generally wouldn’t expect to see a large movement in the rates of voter registration from year to year, since once voters are registered, they typically stay on the rolls until they move or die. But the Current Population Survey data for voting registration among Massachusetts residents fluctuated wildly between 2008 and 2010. The registration gap between whites and blacks ballooned from 13.8 percentage points in 2008 to 36.5 percent in 2010, an almost threefold increase in just two years. Such a large change casts doubt on how reliable the Massachusetts sample is.
• The Current Population Survey has some questionable policies for coding respondents’ answers on voting questions. Last year, McDonald, the George Mason professor, began noticing some unusual patterns in the Current Population Survey’s raw data, and he wrote about it.
The survey allows one of two possible answers to the question of whether a respondent (or someone else in their household) voted in the last election: "yes" and "no." That made sense, until McDonald realized that the survey had a curiously broad definition of "no." With questionable logic, the survey counted three categories of answers as "no" -- if a respondent refused to answer the question, if the person answering the question didn’t know whether someone else in the household had voted, or if they were somehow not asked the voting question.
This caused big problems for the data, McDonald concluded: It means the Current Population Survey data counts many more respondents saying "no I did not vote" than actually didn’t vote; worse, the likelihood of obtaining these non-answers differs by racial group. For instance, in 2008, McDonald found, 21.9 percent of Massachusetts blacks were counted as having a "non-answer" on the voting question, compared to 13.5 percent of Massachusetts whites.
McDonald tried to rectify this problem by re-calculating the data using only the clear "yes" and "no" answers. When McDonald looked only at the clear responses, he found that the voting percentages in Massachusetts ended up at 80.2 percent for whites and 78.0 percent for blacks -- a statistically insignificant difference.
Even if you assume the Current Population Survey is a good source of data, Roberts has cherry-picked by citing Massachusetts
Let’s say for the moment that, despite the evidence cited above, the Current Population Survey is a valid source of data for Roberts’ purpose. There’s still a case to be made that he’s cherry-picked the data.
We analyzed the registration and voting numbers for 2008 and 2010 and found that Massachusetts was well out of the national mainstream in both years. This becomes clear when you compare Massachusetts to other large, relatively diverse northeastern states. Since most of its New England neighbors have black populations too small for the Census Bureau to provide data, we looked at four other states for comparison -- Connecticut, New Jersey, New York and Pennsylvania.
In 2010, when the white-black registration gap in Massachusetts was a whopping 36.5 percentage points, the average for the other four northeastern states was a much more modest 9.8 percentage points. Two years earlier, Massachusetts voting rates showed a 25.8 percentage point white-black gap, compared to just 6.3 percentage points for the other northeastern states.
It’s unclear why the Massachusetts data was so different, but if Roberts wanted to make his point by looking at the voting gaps in large, northeastern, "liberal" states, he could have chosen four that had relatively modest racial gaps. Instead, he chose the one outlier, Massachusetts, and that amounts to cherry-picking.
Where Roberts has a point
Roberts is on more solid ground with his discussion of Mississippi. Unlike the comparison of Massachusetts to its northeastern neighbors, Mississippi’s data in the Current Population Survey fits in closely with that of its neighbors in the deep south, which we’ll count as including Alabama, Georgia, Louisiana, Mississippi and South Carolina. And because the black population in these states is proportionally much larger than it is in Massachusetts, the margins of error for these states in the Current Population Survey are much less problematic.
In 2010, three of these deep south states had black registration rates higher than for whites, and four had black voting rates higher than for whites. The remaining deep south states were roughly at parity between the races. And this pattern was much the same in 2008.
Perhaps even more striking, this pattern was particular to the deep south. Black registration and voting rates were much less likely to exceed that of whites in other southern states -- Arkansas, Florida, Kentucky, North Carolina, Oklahoma, Tennessee, Texas and Virginia.
So why has there been such strong black voting activity in states of the deep south? The government and supporters of the existing law say these high rates of participation stem from the Voting Rights Act’s preclearance provision itself, and they cite this as a major argument for keeping the law as is. Experts also suggest that the experience of living through the civil rights battles of the 1960s, or hearing about them from older relatives, has shaped a culture in which African-Americans in the deep south make a special point of voting.
Whatever the reason, the high rates of participation suggest that Roberts has a point: Voting rates in Mississippi, and the deep south generally, have improved over the years.
McDonald acknowledges this point -- even though he filed an amicus brief in the Shelby County case in favor of keeping the law as is.
The chief justice "has a legitimate question that has to be asked and answered -- if you aggregate up the southern states, we know that turnout among African-Americans has gone up," McDonald said. "He would have been much better served if he hadn’t cherry-picked. He deserved to have that question answered."
Our ruling
Roberts said, "Do you know which state has the worst ratio of white voter turnout to African-American voter turnout? Massachusetts. Do you know what has the best, where African-American turnout actually exceeds white turnout? Mississippi."
For several reasons -- including unacceptably wide margins of error, strange year-to-year inconsistencies and problematic coding policies -- the survey data Roberts likely used to back up his point on Massachusetts is questionable. And even if this data source had been reliable for his purposes, Roberts’ decision to hold up Massachusetts as his primary example amounts to cherry picking, since its data diverges significantly from that of its regional neighbors.
However, Roberts makes a valid point when he notes that black voter turnout in Mississippi and other deep south states is high, and indeed often exceeds white turnout. So while Roberts is on shaky ground with Massachusetts, he’s on more solid turf when it comes to Mississippi. On balance, we’ll call it Half True.
U.S. Supreme Court, transcript of oral argument in Shelby County, Ala., vs. Holder, Feb. 27, 2013
U.S. Census Bureau, main index page for historical voting data in the Current Population Survey, accessed March 5, 2013
U.S. Census Bureau, Table 4b; Reported Voting and Registration by Sex, Race and Hispanic Origin, for States, November 2010
U.S. Census Bureau, Table 4b. Reported Voting and Registration of the Voting-Age Population, by Sex, Race and Hispanic Origin, for States, November 2008
Michael P. McDonald, "Is Minority Voter Registration Really Declining?" May 7, 2012
Bloomberg, "Voting Rights Act Challenge Gets U.S. High Court Hearing," Nov. 10, 2012
Boston Globe, "Massachusetts official challenges Chief Justice Roberts’ claim about voting," Feb. 28, 2013
Email interview with Glen Browder, former Democratic Member of Congress and professor emeritus in political science at Jacksonville State University in Jacksonville, Ala., March 5, 2013
Email interview with Jess Brown, political scientist at Athens State University in Athens, Ala., March 4, 2013
Email interview with Jack Bass, political scientist at the College of Charleston in Charleston, S.C., March 4, 2013
Email interview with Stephen L. Rozman, political scientist at Tougaloo College in Tougaloo, Miss., March 4, 2013
Email interview with Alan Abramowitz, political scientist at Emory University in Atlanta, Ga., March 4, 2013
Email interview with Jeffrey Berry, political scientist at Tufts University in Boston, Mass., March 4, 2013
Interview with Michael P. McDonald, political scientist at George Mason University, March 4, 2013


In a world of wild talk and fake news, help us stand up for the facts.