Says Donald Trump "won more counties than any candidate on our side since Ronald Reagan."


Our only agenda is to publish the truth so you can be an informed participant in democracy.
We need your help.

With a split in the 2016 Electoral College and popular votes, there’s been an unusual amount of jockeying this year over how to frame the Election Day results.
On the Dec. 4, 2016, edition of NBC’s Meet the Press, Vice President-elect Mike Pence used the yardstick of counties won to explain why Donald Trump’s victory was a watershed.
"To be around Donald Trump, as you know, having known him for a number of years, is to be around a man of boundless energy from literally the day after the election," he said, "a historic election where he won 30 out of 50 states (and) more counties than any candidate on our side since Ronald Reagan."
Is this correct? It is, though election experts say it speaks to longtime Republican dominance in rural areas.
A closer look at the numbers
We were able to secure statistics for counties won by each presidential candidate from Dave Leip, creator of the indispensable "Atlas of U.S. Presidential Elections" website.
The following chart shows the breakdown in counties won by each party’s nominee going back to 1984, which was Reagan’s last election as well as the one in which he won every state except one (Minnesota). Two housekeeping notes: The data for 2016 is preliminary, and Alaska doesn’t calculate vote data by borough, which is that state’s equivalent of a county.
Election
Republican counties won
Democratic counties won
Independent counties won
2016
2,623
489
0
2012
2,420
693
0
2008
2,238
875
0
2004
2,530
583
0
2000
2,397
659
0
1996
1,587
1,526
0
1992
1,582
1,519
15
1988
2,295
820
0
1984
2,781
334
0
So Pence is on target that the number of counties won by Trump exceeds the number of counties won by every Republican presidential candidate since Reagan in 1984.
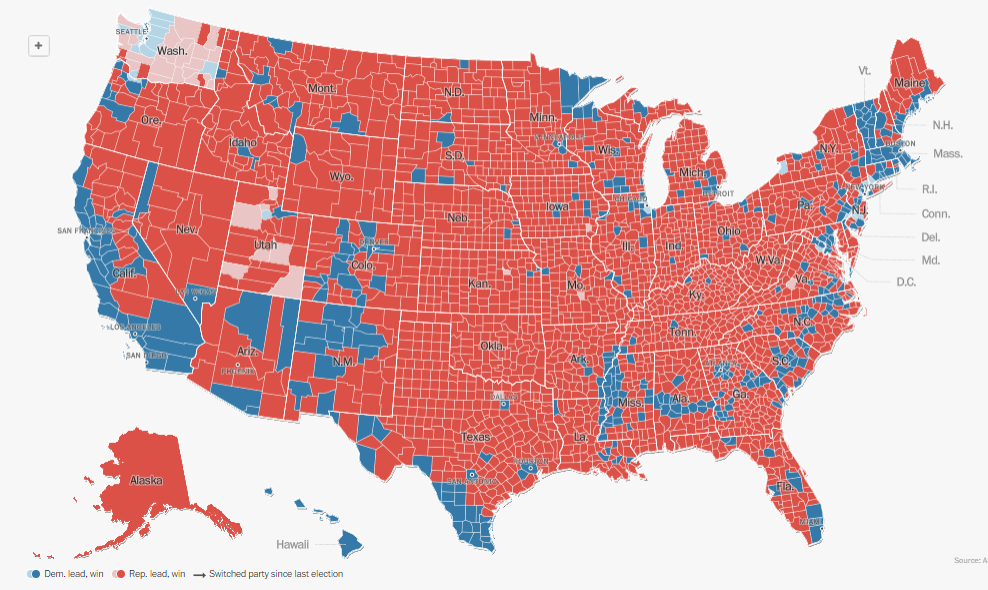
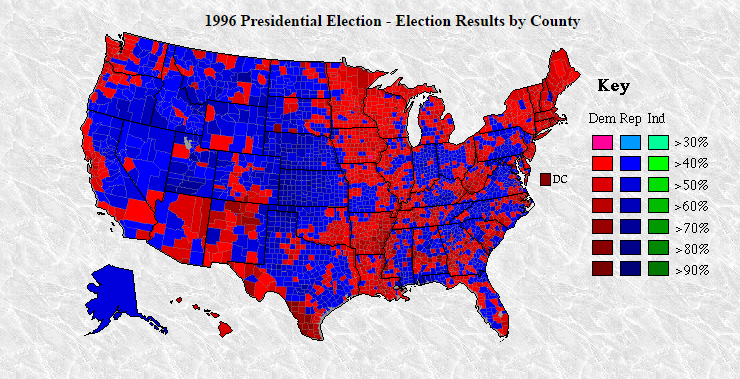
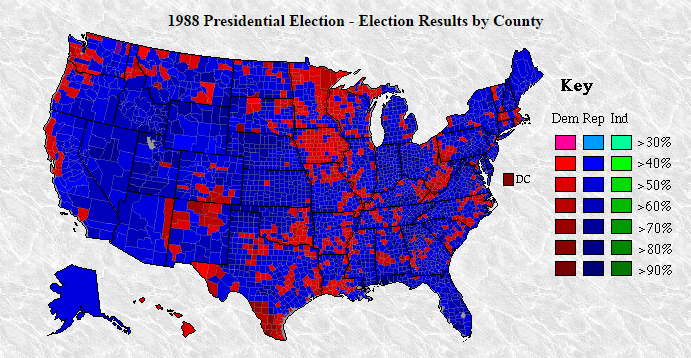
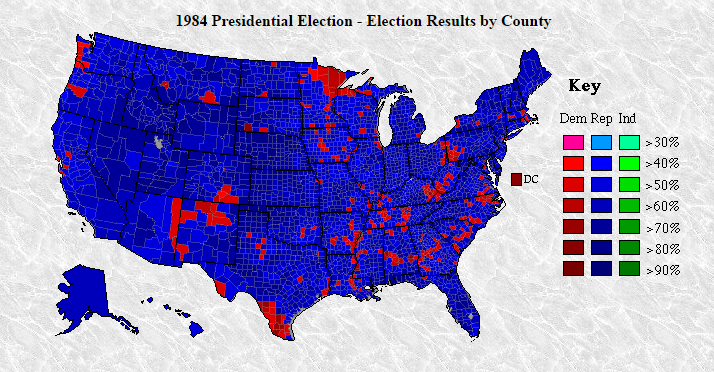
For a more visual look, here are maps showing the counties won by the parties in each of those elections. Note that the 2016 map, from the Washington Post, uses the now-traditional Democratic blue-Republican red color scheme.
2016
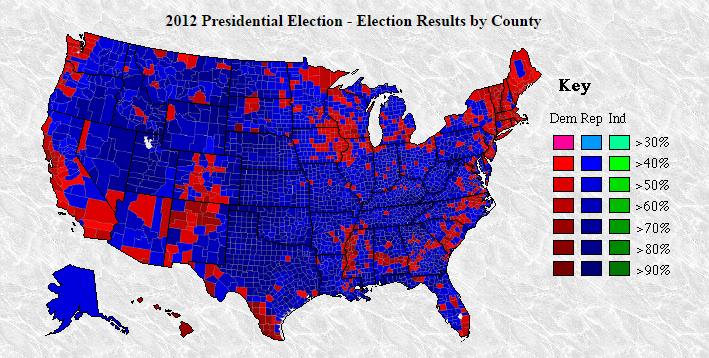
The rest of the maps, from Leip's website, use blue coloring for Republican counties and red coloring for Democratic counties. (For the record, Leip started using his coloring code in 1994, before the current version became standard; he says that changing every map on his site would require an enormous time commitment.)
2012
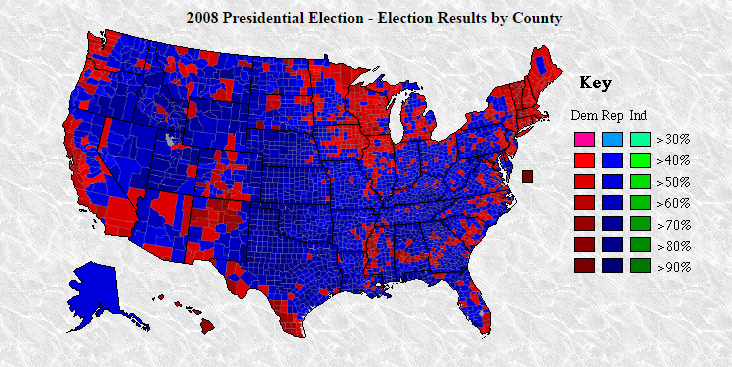
2008
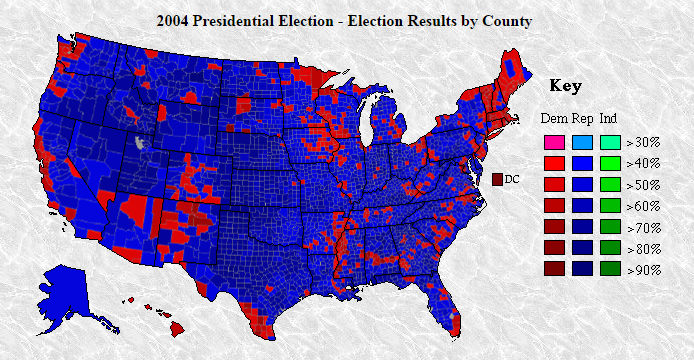
2004
2000
1996
1992
1988
1984
Trump receives credit from electoral specialists for expanding the Republican footprint, notably in places that had previously backed Barack Obama. According to a calculation by Time magazine, Trump won 220 counties that had voted for Obama in 2012, while Hillary Clinton took far fewer -- 17 -- that had gone for Mitt Romney, the 2012 GOP nominee.
And Trump outperformed Romney’s vote share in 2,728 counties, compared to just 383 where Clinton outperformed Obama.
But the places where Clinton performed better than Obama did were almost always in much more populous counties. According to Time’s calculations, the counties where Clinton gained ground on Obama had a median of 75,554 voters in 2016. The comparable figure for the counties where Trump exceeded Romney’s performance was 9,905 voters. So the median Clinton-trending county was more than seven times bigger than the median Trump-trending county.
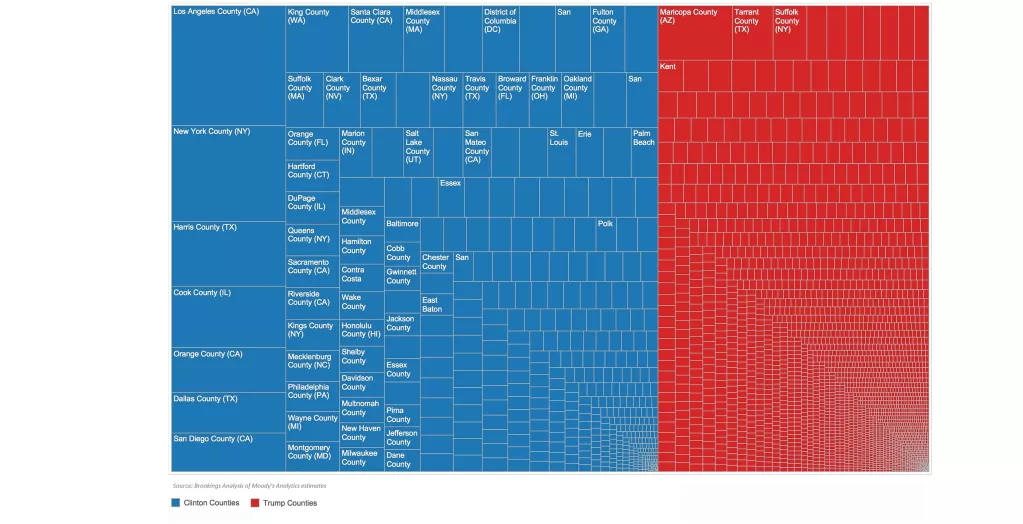
The divide doesn’t stop at population. Mark Muro and Sifan Liu of the Brookings Institution crunched the numbers on the overall economic output of Clinton and Trump counties. Their finding? Clinton’s comparatively tiny number of counties "encompassed a massive 64 percent of America’s economic activity," compared to 36 percent for Trump’s much larger stable of counties. Here’s a graphical representation of what they found, with Clinton counties in blue and Trump counties in red, and each county’s rectangle scaled to the size of the output in that county:
"Here you can see very clearly that with the exceptions of the Phoenix and Fort Worth areas and a big chunk of Long Island, Clinton won every large-sized county economy in the country," the authors wrote. "Trumpland consists of hundreds and hundreds of tiny low-output locations that comprise the non-metropolitan hinterland of America, along with some suburban and exurban metro counties."
All of this illustrates a general pattern for Democrats in recent election cycles: They have run strongly in populous and economically growing urban and suburban areas, but poorly in lightly populated rural areas. This has been true for the entire period we’re looking at -- in fact, Bill Clinton never managed to win more counties during his two victories in the 1990s -- but the partisan disparity has been growing steadily. And the pattern reached a new apogee with the Trump vs. Clinton race.
This helps explain why Clinton has so far won 2.6 million more votes than Trump did -- almost 2 percentage points more -- while losing so many counties.
"Loving County, Texas, has a population of 82, while California’s Los Angeles County has over 9.8 million," said Costas Panagopoulos, a Fordham University political scientist. "The number of counties won is not necessarily a meaningful indicator, absent any consideration of the population of these counties."
Seth Masket, a University of Denver political scientist, agreed.
"Partisanship increasingly correlates with urbanism," he said. "There are a lot more rural counties than urban ones, so I'd expect Republicans to be winning more and more counties over time. So the claim that the GOP is winning more counties is possibly an interesting reflection on residential living patterns, but it doesn't really reflect what the voters wanted or what the government has a mandate to address."
Our ruling
Pence said that Trump "won more counties than any candidate on our side since Ronald Reagan."
The electoral results leave little doubt that Trump expanded Republican success compared to Romney’s baseline in many corners of the country. However, it’s important not to overstate the importance of the statistic Pence cited. Clinton may have won fewer counties overall, but the ones she did win tended to be much more populous and economically dynamic.
The statement is accurate, but it needs an asterisk, so we rate it Mostly True.
https://www.sharethefacts.co/share/ea7c6f37-927c-4edc-9de7-f78fd53257aaMike Pence, interview on NBC’s "Meet the Press," Dec. 4, 2016
Atlas of U.S. Presidential Elections, accessed Dec. 4, 2016
Brookings Institution, "Another Clinton-Trump divide: High-output America vs low-output America," Nov. 29, 2016
Washingtpn Post, live results of election 2016, accessed Dec. 4, 2016
David Wasserman, National Popular Vote Tracker, accessed Dec. 4, 2016
Washington Post Fix blog, "Thanks to a bad map and bizarre math, Breitbart can report that Trump won the REAL popular vote," Nov. 15, 2016
Time magazine, "See a Map That Shows Exactly How Donald Trump Won," Dec. 1, 2016
Email interview with Dave Leip, creator of the "Atlas of U.S. Presidential Elections," Dec. 4, 2016
Email interview with Costas Panagopoulos, Fordham University political scientist, Dec. 4, 2016
Email interview with Seth Masket, University of Denver political scientist, Dec. 4, 2016
Email interview with Alan Abramowitz, Emory University political scientist, Dec. 4, 2016
Email interview with Steven Cheung, spokesman for Donald Trump and Mike Pence, Dec. 4, 2016


In a world of wild talk and fake news, help us stand up for the facts.