

Gov. Bob McDonnell used some historical context to argue the national debt is on an unsustainable arc.
"After World War II, we (had) just about 100 percent of GDP tied up in debt, but over 30 years there was a reduction in the debt until the 1980s," McDonnell said in a video interview posted online May 20 by Human Events, a conservative website.
With all the talk about the U.S. hitting the $14.3 trillion debt ceiling recently, it’s hard to imagine an era when the government actually reduced its borrowing load in proportion to the national economy.
We wondered if McDonnell was right.
The governor was talking about U.S. debt as a percentage of the country’s gross domestic product, which is the value of all goods and services produced in the nation. Economists say the percentage is important because it measures a nation’s ability to support its debt.
After World War II, did that percentage slide down in the U.S. until the 1980s?
Before we get into the numbers, it’s helpful to point out at that the U.S. national debt is made up of two components. The biggest chunk is publicly held debt owed to investors, the Federal Reserve as well as state and local governments that have purchased U.S. securities. The second piece is debt held by government accounts, mostly trust funds for Social Security, Medicare, military retirement and other programs.
We asked the governor’s office where the information for his statement came from.
Jeff Caldwell, a spokesman for the governor, sent us a Congressional Budget Office table showing the level of publicly held debt as a percentage of GDP from 1790 to 2000. That graphic shows a relatively steady drop from the post-World War II peak to around 1980.
To get an idea of how the debt level changed each year between the mid-1940s and the 1980s, we also examined historical tables on the Office of Management and Budget’s website.
Let’s start with 1946, the year after World War II ended. At the end of that fiscal year, the Gross Federal Debt -- the total of public and government debt -- was 121.7 percent of GDP, its highest ever. That went on a general decline over 35 years, although there were about a half dozen times when the debt’s share of GDP rose year-to-year before dropping off again. In 1979, debt amounted to 33.2 of GDP.
If you look at just publicly-held debt as a percentage of GDP, it followed the same trajectory. It’s highest proportion of GDP was also in 1946, when it was 108.7 percent of the nation’s economic output. That also fell off gradually until 1979, when publicly held debt was 25.6 percent of GDP.
So either way you count the debt -- total debt or just publicly-held debt -- McDonnell is correct that as a share of GDP it dropped over the roughly 35-year span between World War II’s end and the 1980s.
The total national debt as a percentage of the GDP rose during the 1980s and fell in the late 1990s. But since 2001 it’s been on the rise. Total debt is projected to be 102.6 percent at the end of the 2011 fiscal year, according to the OMB.
McDonnell warned that U.S. debt total is on its way to "record levels." As a percentage of GDP, the total debt still has a way to go before hitting its record level of 121.7 percent in 1946.
Measured only in dollars, the national debt for the most part has been rising since the end of World War II.
The total national debt was $270.1 billion in 1946. It increased fairly consistently to its current level of roughly $14.3 trillion on April 30, 2011.
Let’s review.
McDonnell said that since the end of World War II, the national debt as a percentage of GDP went down over a roughly 30-year period until the 1980s.
McDonnell is correct that the debt, when measured as a percentage of the country’s GDP, was on a downward trajectory during that time.
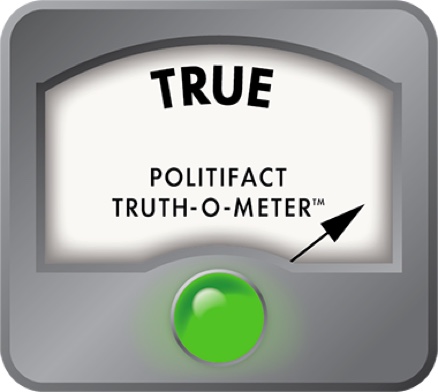
We rate his claim True.
Human Events interview with Gov. Robert McDonnell,posted May 20, 2011. (Statement is about 1 minute, 25 seconds into video).
Office of Management and Budget table, "Table 7.1-Federal debt at the end of year: 1940-2016,"accessed May 23, 2011.
U.S. Government Accountability Office report, "Federal debt: answers to frequently asked questions,"accessed May 23, 2011.
Office of Management and Budget, "Fiscal Year 2012 Historical Tables Budget of the U.S. Government,"accessed may 23, 2011.
U.S. Treasury Department, "Monthly Statement of the public debt of the United States,"April 30, 2011.
E-mail from Jeff Caldwell, Gov. Robert McDonnell’s spokesman on May 23, 2011.
Congressional Budget Office table, "Federal debt held by public, 1790 to 2000," July, 2010.
usgovernmentspending.com charts on U.S. federal debt, accessed May 23, 2011.
In a world of wild talk and fake news, help us stand up for the facts.