
Under Barack Obama, "the fewest number of adults are working since Jimmy Carter’s presidency."


Our only agenda is to publish the truth so you can be an informed participant in democracy.
We need your help.
After the president talked up national job gains, a Central Texas member of Congress suggested things haven’t been rosy.
U.S. Rep. Roger Williams, R-Austin, whose district stretches nearly to Fort Worth, said in a Jan. 12, 2016, response to the State of the Union address: "It’s been seven years since President Barack Obama took office. In that time, the United States has accumulated the largest national debt in its history, the fewest number of adults are working since Jimmy Carter’s presidency and the executive branch has expanded its power immensely – the president has chosen which laws to enforce and created new ones without Congress’ approval."
The national debt, in raw dollars, is at a record high, and Obama has issued provocative executive orders though, PolitiFact found in 2014, fewer orders than most recent predecessors.
A reader asked us if Williams was correct about the country having fewer working adults than when Carter was president from 1977 into January 1981. Just given population growth, could that be?
We asked Williams’ spokesman Vince Zito how Williams reached his conclusion and didn’t hear back.
In 2012, PolitiFact explored similar territory, finding Mostly False a claim that the American "workforce" was smaller than when Carter was president. The word "workforce" refers to the absolute number of people employed or seeking work; that tally was way up by 2012 compared with Carter’s era due to population growth and, through the 1990s, the expansion of working women.
Counting workers
So, did the number of working adults subsequently plunge to Carter-era levels?
No, according to the Bureau of Labor Statistics, whose figures indicate that in 1980, around 100 million people were in the civilian workforce. In 2015, bureau figures show, nearly 150 million Americans were in the workforce -- up about 50 percent from Carter’s last year as president.
By phone to our inquiry, economist Stephen Rose of the Urban Institute, a former deputy in the Department of Labor, told us Williams’ claim isn’t supported. "Not close," Rose said.
A chart in the 2015 Economic Report of the President shows 99.3 million people comprised the civilian workforce in 1980 and 146.3 million were in the workforce in 2014.
Another bureau chart indicates 149.7 million people in the workforce in December 2015 and also that the workforce increased nearly every year from 1980 through 2015 -- with the exceptions of 1982, 1991, 2002 and 2008 through 2010, a period encompassing the end of George W. Bush’s terms and the first two years of Obama’s tenure.
From 2010, when an Obama-low 139 million people were in the workforce, the count inched to nearly 140 million in 2011; 143 million in 2012; 144 million in 2013 and 146 million in 2014, according to the bureau.
Employment-population ratio
By another indicator, Rose said, it’s possible to compare the share of Americans who had jobs in Obama’s years with the share of job-holders when Carter was president.
The BLS, drawing on results from the American Community Survey conducted by the U.S. Census Bureau, calculates the employment-population ratio to reflect the proportion of the civilian noninstitutional population aged 16 years and over that’s employed.
The highest ratio under Obama was 60.6 in January 2009, the month he was sworn in. The lowest ratio on his watch, 58.2, was set in November 2010 and June and July 2011.
In Carter’s four years as president, according to the bureau, the highest ratio, 60.1, was reached in February and December 1979 and the lowest ratio, 57.0, occurred in January 1977, the month he was sworn in (it nudged to 57.2 the next month).
Labor force participation
We wondered if another indicator might be relevant. That statistic is the civilian labor force participation rate -- meaning the labor force, civilians 16 and older working full- or part-time, divided by the civilian population.
According to the BLS, 62.6 percent of the population comprised the labor force in December 2015, the latest month of available figures. While Carter was president, a bureau chart indicates, the participation rate fluctuated from 61.6 percent in January 1977 to 64 percent in January and February 1980.
Score one for Williams, though the rate on Obama’s watch peaked at 65.8 percent in February 2009--which was higher than any rate in Carter’s years or the first seven years of successor Ronald Reagan’s tenure. The rate was 66.5 percent when Reagan left office in January 1989.
Labor force changes
There’s another chewy issue: Demographics, particularly the aging of the population, have affected changes in the workforce, making comparisons between current times and Carter’s era tricky. In the 2000 Census, Americans aged 60 to 69 -- that is, those who had recently hit retirement age or would do so soon -- numbered about 20 million. But thanks to Baby Boomers, that number surged in the 2010 Census to more than 29 million, for almost a 50 percent increase. This matters because the more people aged 60 to 69, the more people who pass into retirement age -- or, put another way, leave the labor force. Even though more people proportionally remain in the workforce after retirement age, the difference isn’t big enough to cancel out the flood of new retirees.
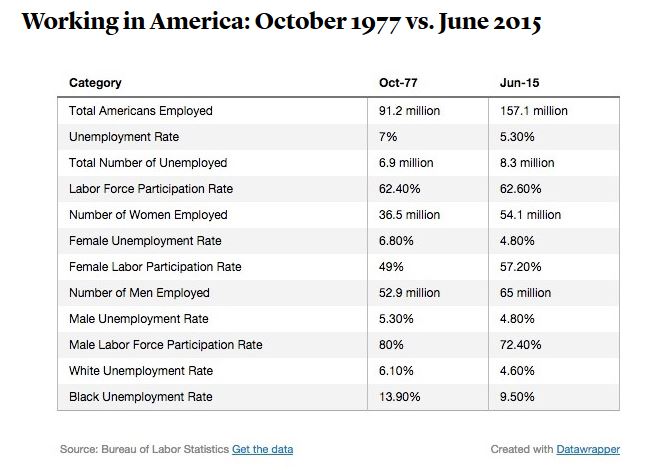
In 2015, Atlantic magazine published a chart contrasting the workforce in October 1977, in Carter’s first year as president, and June 2015, in the seventh year of Obama’s tenure:
SOURCE: Story, "How America's Workforce Has Changed Since 1977," the Atlantic, July 2, 2015 (accessed Jan. 21, 2016)
Our ruling
Williams said that under Obama, "the fewest number of adults are working since Jimmy Carter’s presidency."
This claim doesn’t hold up in that far more people were working the past few years than in Carter’s time as president. According to a government calculation, about the same share of adults was employed during each Democrat’s presidency.
We rate this statement False.
FALSE – The statement is not accurate.
Click here for more on the six PolitiFact ratings and how we select facts to check.
Truth-O-Meter article, "Ad says workforce smaller under Barack Obama than any time since Jimmy Carter," PolitiFact, Oct. 8, 2012
Telephone interview, Stephen Rose, affiliated scholar, Income and Benefits Policy Center, the Urban Institute, Jan. 21, 2016
Chart, "Table B-11. Civilian population and labor force, 1929–2014," 2015 Economic Report of the President, Chairman of the Council of Economic Advisers, the White House, February 2015
Report, "An Overview of the Employment-Population Ratio," Congressional Research Service, May 27, 2015
Charts drawn from labor force statistics based on American Community Survey, Bureau of Labor Statistics, "Number Employed, 1977-2015," "Labor Force Participation Rate, 1977-2015," "Employment-Population Ratio, 1977-2015," (downloaded Jan. 21, 2016 from research starting from website, "Labor Force Statistics from the Current Population Survey," BLS)


In a world of wild talk and fake news, help us stand up for the facts.