While Republicans are typically considered anti-abortion, the rate of abortions under Democratic presidential administrations has actually fallen more precipitously, a Facebook post claims.
The post argues the difference relates to the Democrats’ approach of making abortions unnecessary by providing contraception, compared with the Republican approach to make the procedure less available.
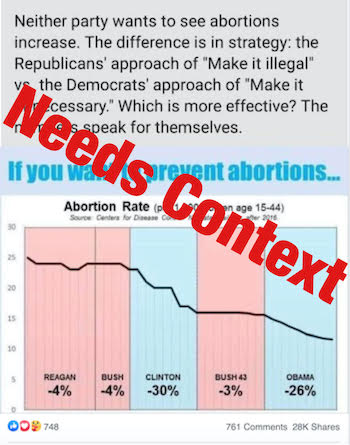
A graphic shows steep falls under Clinton and Obama administrations. Text above the graph reads, "For anyone who opposes Trump but hesitates to vote Democrat because of the abortion issue, here’s some food for thought:
"Neither party wants to see abortions increase. The difference is in strategy: the Republicans approach of ‘Make it illegal’ vs. the Democrats approach of ‘Make it unnecessary.’ Which is more effective? The numbers speak for themselves."
The post was flagged as part of Facebook’s efforts to combat potential false news and misinformation on its News Feed. (Read more about our partnership with Facebook.)
The graph, which cites the Centers for Disease Control and Prevention as its source, shows a declining abortion rate in the U.S. starting in the Reagan administration through the end of Obama administration. (It doesn’t show data from the Trump years.) It shows the rate of abortions declining marginally under Republican presidents and more dramatically under Democrats.
In analyzing the post, we found two issues. First, states voluntarily report abortion data to the CDC, and which states report data varies wildly from year to year. For instance, California hasn’t reported abortion data in more than two decades. Second, experts say the post oversimplifies the reasoning behind the decline and overstates the role the occupant of the White House plays.
The CDC data and historical rates of abortions in the U.S.
Since 1969, the CDC has attempted to collected nationwide data to document the number of legal abortions, the abortion ratio (abortions versus live births), and the abortion rate (number of abortions per 1,000 women ages 15-44).
But the CDC data isn’t complete because not all abortions are counted.
The latest CDC abortion report, from 2016, used data from health agencies of 48 reporting areas (New York City and 47 states). But it did not include California, the District of Columbia, Maryland and New Hampshire — about 14% of the country’s population.
That makes comparisons over time periods — or in this case presidential administrations — challenging.
Overall, the CDC says that the known number of abortions increased rapidly in 1973, after Roe vs. Wade, and reached their highest levels in the 1980s before decreasing "at a slow yet steady pace."
The CDC says the decline temporarily slowed between 2006-08, before resuming.
The specific declines cited in the graphic
According to the Facebook graphic, the abortion rate (per 1,000 women ages 15-44) declined 4% in the Reagan administration, and another 4% in George H. W. Bush’s four-year presidency. Then, it plummeted by 30% during President Bill Clinton’s two terms, and slowed once again during President George W. Bush’s two terms, with only a 3% drop.
The last large decrease, the chart shows, came in the Obama years with a 26% decline. The most recent CDC abortion surveillance report is from 2016.
The percentage decreases generally line up with the available CDC data we reviewed. Though, that data isn’t perfect.
From 1973 through 1997, the CDC compiled the data from 52 reporting areas in the United States: the 50 states, the District of Columbia, and New York City. But that changed in 1998 (states send in the data voluntarily). That year, the CDC received abortion data from 48 reporting areas, instead, excluding Alaska, California, New Hampshire and Oklahoma.
States have continued to swap in and out over the ensueing years, but it’s notable that California, the most populous state, has remained constant and hasn’t submitted any abortion data since it stopped in 1998.
What to make of the numbers
"I think it is an oversimplification to say there is an association between the abortion rate and the political party occupying the White House," said Dr. Daniel Grossman, a professor of obstetrics, gynecology and reproductive sciences at the University of California, San Francisco.
"Many of the policies that might affect the abortion rate vary at the state level. These include things like whether there has been an expansion of programs, including Medicaid, to provide contraception for people living on low incomes, or alternatively, policies that might make it more difficult for clinicians to provide abortion care."
Nearly all abortion challenges have, indeed, come at the state level. The federal outliers are the 1976 Hyde Amendment, which prohibits the federal government from covering the costs of abortions except in very rare cases, and the 2003 Partial-Birth Abortion Ban Act, which prohibits a form of late termination of pregnancy.
But by and large, federal lawmakers have had trouble passing abortion restriction laws.
The Guttmacher Institute, which supports abortion rights, compiles abortion data every three years and surveys hospitals, abortion clinics and health departments.
In 2017, the organization reported that the U.S. abortion rate had decreased to record low levels, dropping to 13.5 abortions per 1,000 women aged 15–44, the lowest rate recorded since abortion was legalized in 1973.
The decline may be due to fewer women becoming pregnant and increased access to contraception rather than by laws restricting abortions, said Elizabeth Nash, the institute’s senior state policy manager.
"Between 2011 and 2017, the abortion decline appears to be driven by fewer people becoming pregnant in the first place, as both abortions and births declined. If abortion restrictions were the main driver across the board, we’d expect the birth rate to increase," Nash said. "There are a lot of potential factors at play, including increased access to affordable contraception (due to the Affordable Care Act among other policies that make it easier to afford contraception), new methods of contraception, and changing pregnancy desires and attitudes."
Our ruling
A Facebook post shares a graph on U.S. abortion rates and says the larger declines during recent Democratic presidential administrations is due to the party’s approach of making abortions unnecessary, rather than the Repbulican party’s approach of making them illegal.
The graphs cites CDC data, but health department reporting on abortions has fluctuated so much over the years that making broad comparisons can prove challenging. Not every state has reported its abortion data for every year.
Moreover, experts said tying the abortion rate to the occupant of the White House alone is an oversimplification of a variety of factors that are at play.
We rate this claim Half True.