
Austin has "gone from being the 24th most congested city just about 10 years ago to being the fourth most congested — more congested than NYC."


Traffic in Austin is so awful, Mayor Steve Adler declared, there’s less congestion in the Big Apple.
Adler, speaking to the Greater Austin Chamber of Commerce, said April 1, 2015: "We have gone from being the 24th most congested city just about 10 years ago to being the fourth most congested — more congested than NYC," Adler said, according to his prepared remarks emailed later to an Austin American-Statesman editor.
Is all of that so?
Austin’s congestion may have gotten even worse, we learned, though hizzoner’s New York angle overlooks that drivers bent on reaching the boroughs have longer commutes.
To our inquiry, mayoral aide Jim Wick said Adler relied on traffic scorecards for different years put out by Inrix, a company that says it analyzes real-time traffic conditions as part of its focus on "understanding the science of traffic." In the latest Inrix scorecard, Wick noted by email, Austin landed fourth in traffic congestion, New York fifth.
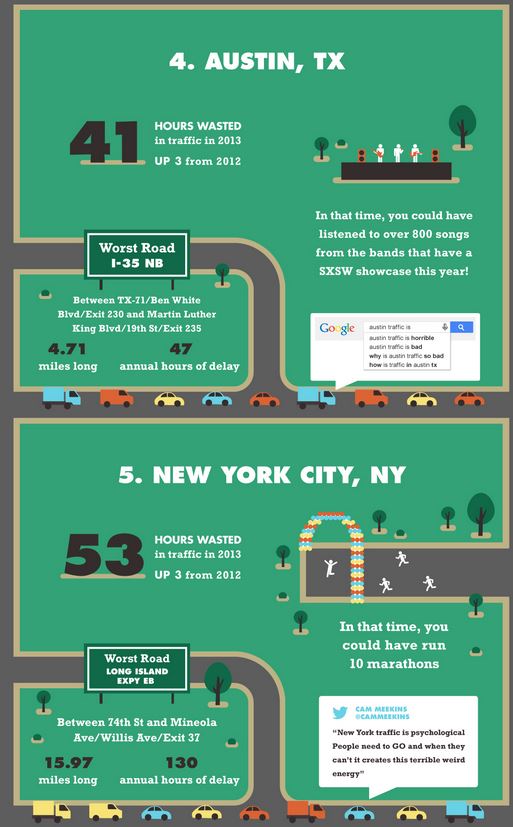
We confirmed those rankings as cited. But a March 2014 Inrix summary of its latest report, based on traffic conditions in 2013, suggests Austin motorists wasted fewer hours stuck in traffic on average that year (41 hours) than drivers in New York, who averaged 53 wasted hours. Cities with more hours wasted in traffic were Los Angeles (No. 1), Honolulu and San Francisco, Inrix said.
Inrix’s illustration of the Austin-New York results:
SOURCE: Blog post, "Three Takeaways from INRIX’s 7th Annual Traffic Scorecard," Inrix website, March 2014 (accessed April 8, 2015)
Still, Austin ranked No. 1 nationally in traffic complaints made on Twitter, besting Los Angeles, Washington, D.C., and Seattle, according to the summary.
And did Austin rank 24th in congestion a decade past? Wick emailed us a February 2009 Inrix scorecard, based on traffic conditions in 2008, placing Austin-Round Rock 21st nationally that year and 26th in 2007. (This is a good time to stress that each city analyzed by Inrix is the city’s metropolitan area, sweeping in nearby communities.) Wick said the mayor's prepared remarks may have had a typo; they should have said 24th.
Inrix: Austin congestion ‘getting worse’
Next, we turned to Inrix to ask why Austin edged New York in the latest congestion rankings even though New York drivers piled up more hours stuck behind trucks.
Inrix spokesman Jim Bak reaffirmed that New York drivers spent more time on average stuck in traffic in 2013, but Austin ranked worse in "congestion intensity" according to the Inrix index basically showing how bad traffic gets at peak drive times, Inrix says.
For a road segment with no congestion, for instance, the index score is zero. Each additional point in the index represents a percentage point increase in the average travel time of a commute during peak travel hours compared to free-flow conditions. Peak times are defined as the weekday hours from 6 a.m to 10 a.m. and 3 p.m. to 6 p.m.
For 2013, Inrix says, Austin had a higher index than New York. In fact, more up-to-date Inrix data indicates that in the 12 months through July 2014, Austin still ranked fourth nationally with an Inrix index score of 23.3; New York, by then placing sixth nationally, had a score of 20.7.
What this means: Austin drivers accustomed to a 20-minute free-flow trip were taking nearly 25 minutes to make the same trip at peak times--reflecting a 23 percent increase of four minutes and forty seconds over free-flow conditions. The traffic delay exceeded the comparable pause for New York drivers by 32 seconds, per Inrix.
By Inrix’s research, Bak indicated, Inrix’s report covering conditions in 2008 placed Austin’s index 21st nationally compared to 26th in 2007, he said.
In 2008, cities that had worse traffic than Austin according to the Inrix index included Chicago, Dallas-Fort Worth, Washington, D.C., Houston, Boston, Seattle, Minneapolis, Philadelphia, Atlanta, Phoenix, Miami, San Diego, Denver, Baltimore, San Jose and Detroit.
Drumming the Truth-O-Meter, we asked Bak to unpack the New York contrast. Can it really be Austin has worse congestion? After all, you rarely see a New York movie without cars piled bumper to bumper. Bak conceded New York drivers, on average, face longer commutes. But focusing solely on drive times to judge congestion, Bak said, would lead to results driven by population.
We looked for alternate congestion analyses.
Census Bureau survey
By email, Alan Pisarski, a Virginia transportation expert, responded to our inquiry by suggesting we consider the latest federal survey indicating how long it takes Americans to get to work.
The U.S. Census Bureau’s 2013 American Community Survey asked respondents to say how many minutes it usually took to get from their home to work the previous week. Austin residents reported average travel times of 23.5 minutes, placing the city behind more than 300 others with 65,000 residents or more, according to a chart emailed to us by a bureau spokesman. Cities with longer reported travel times included Pittsburgh and New York, with 40-minute averages; Chicago, 34 minutes; Philadelphia and San Francisco, 32 minutes each; Baltimore, 31 minutes; Los Angeles and Boston, 30 minutes each; Detroit, 27 minutes; Houston, 26; Las Vegas, 25--and many more.
Bureau spokesman Robert Bernstein also emailed a chart showing the survey results by metropolitan region. By that filter, drivers from the New York-Jersey City-White Plains, N.Y. area reported travel times of nearly 37 minutes, the second-longest nationally. Drivers from the Austin-Round Rock area had travel times of 26 minutes, ranking behind more than 90 areas.
Texas A&M Transportation Institute
We also reached out to the Texas A&M Transportation Institute, which has long gauged traffic conditions. Its 2012 "Urban Mobility Report" includes a chart indicating that in 2011 (the latest year checked), New York ranked fourth nationally with 59 hours in average travel delays per auto commuter while Austin tied for 17th with Portland, Oregon and Las Vegas with 44 hours in average travel delays per auto commuter. Another entry in the chart, though, states drivers in peak periods in New York and Austin were experiencing nearly identical percentage increases in travel times, on average.
By phone, the institute’s Tim Lomax pointed out its research compares metropolitan regions, not cities in themselves. So its New York data takes into account portions of New Jersey and Connecticut and its Austin figures sweep in parts of nearby Hays and Williamson counties.


Unlike Inrix, Lomax said, the institute "weights" its results so congestion on heavily travelled roads factors more significantly into results.
Heads up: The institute is teaming with Inrix to produce a report covering 2014 traffic conditions, Bak and Lomax each said. And, Bak said, Austin looks to rank fourth again nationally for congestion with an index score of 24.9, up 7 percent. Congestion, Bak said, "is getting worse," largely due to the improving economy.
Given the A&M institute’s 2011 statistics showed drivers in Austin and New York facing nearly identical percentage increases in drive time but the actual minutes added in travel time were higher in New York, we asked Lomax if the data show Austin is more congested than New York. "I don’t think they do," Lomax said, adding: "By one measure, they have about the same traffic congestion. By another measure, New York is worse than Austin." Still, he added, "by no measure does Austin have a great traffic situation."
A decade ago
We also peeked at charts showing how the institute’s travel time indexes and peak delay times for Austin and New York changed annually from 2006 through 2011. Austin's index ranged from 1.30 to 1.33, often placing the city fourth nationally. New York’s index, ranging from 1.32 to 1.42, ranked No. 1 two years, No. 3 other years. Austin’s average delay per peak-auto-commuter (a mouthful meaning the yearly sum of all the per-trip delays for drivers traveling in peak periods) ranged from a high of 56 hours in 2006 to a low of 43 hours in 2010 with its national rank ranging from 8th to 18th. New York’s comparables were a low of 54 hours of delay in 2006 to a high of 66 hours in 2007, landing the city third to ninth over the years.
TomTom
Lomax pointed us to another outfit that analyzes urban congestion--TomTom, maker of navigational devices. A chart posted online by TomTom in 2015 shows "congestion levels" for cities which it says is the increase in overall travel times at peak hours compared to travel times in free-flow conditions. Sound familiar? In 2014, according to GPS measurements from TomTom's traffic database, New York ranked fourth among the nation’s cities with a congestion level of 31 percent; Austin ranked 13th with a congestion level of 25 percent (the same as the levels in Houston and Tampa).
Then again, TomTom also presents congestion as similar in New York and Austin in that an Austin driver with a 30-minute drive (counting trips to and from work) piled up 21 minutes a day in traffic delays--just like a New York counterpart doing a 30-minute commute.
Nick Cohn, a TomTom traffic expert, called us back from New York and showed us how to check travel time added in morning versus evening peak times for each city. According to TomTom, New York drivers in 2014 faced slightly longer percentage delays weekday mornings--on average, seeing a 48 percent longer trip than in free-flow conditions compared to a Austinites’ 42 percent longer trip. But Austin drivers got delayed incrementally more in evening rush hour--experiencing an average 61 percent bump in travel time compared to free-flow conditions versus New York’s 56 percent surge.
But around the clock and through each week, Cohn said, New York has worse congestion than Austin because its roadways are crowded more often. Taken as a whole, Cohn said, New York has more wasted travel time. "Your chances of hitting a traffic jam outside peak periods is higher in New York than in Austin," he said.
Our ruling
Adler said of Austin: "We have gone from being the 24th most congested city just about 10 years ago to being the 4th most congested. More congested than NYC."
Inrix ranked Austin the nation’s No. 4 worst for congestion through 2013, just ahead of the No. 5 New York area. Also, Austin placed 26th for congestion in 2007, not quite a decade ago.
But there's missing context here in that by various measures, New York’s congestion comes out worse than what Austin drivers have been experiencing.
On balance, we rate this statement Half True.
HALF TRUE – The statement is partially accurate but leaves out important details or takes things out of context.
Click here for more on the six PolitiFact ratings and how we select facts to check.
Emails, Jim Wick, director of community engagement, Office of the Mayor, City of Austin, April 8-9, 2015
Report, "Inrix National Traffic Scorecard, 2008 Annual Report," Inrix, February 2009 (received by email from Jim Wick)
Telephone interview, Jim Bak, director of community relations, Inrix, Kirkland, Washington, April 20, 2015
Chart showing average reported travel times to work in cities of 65,000 residents or more and chart showing average reported travel times to work in metropolitan regions, American Community Survey, U.S. Census Bureau, 2013 (received by email from Robert Bernstein, public affairs specialist, census bureau, April 23, 2015)
Report, "2012 Urban Mobility Report," Texas A&M Transportation Institute, December 2012 (accessed April 23, 2015)
Telephone interview, Tim Lomax, Texas A&M University System Regents Fellow, College Station, April 23, 2015
Reports, "The 2005 Urban Mobility Report," Texas Transportation Institute, Texas A&M University System, May 2005
Charts, "The Mobility Data for Austin, TX," 2006-2011; "The Mobility Data for New York-Newark NY-NJ-CT," Texas A&M Transportation Institute, undated (accessed April 23, 2015)
Chart, "TomTom Traffic Index," TomTom N.V., 2015 (accessed April 23, 2015)
Telephone interview, Nick Cohn, senior business developer, TomTom N.V., New York, April 27, 2015


In a world of wild talk and fake news, help us stand up for the facts.