
Our only agenda is to publish the truth so you can be an informed participant in democracy.
We need your help.
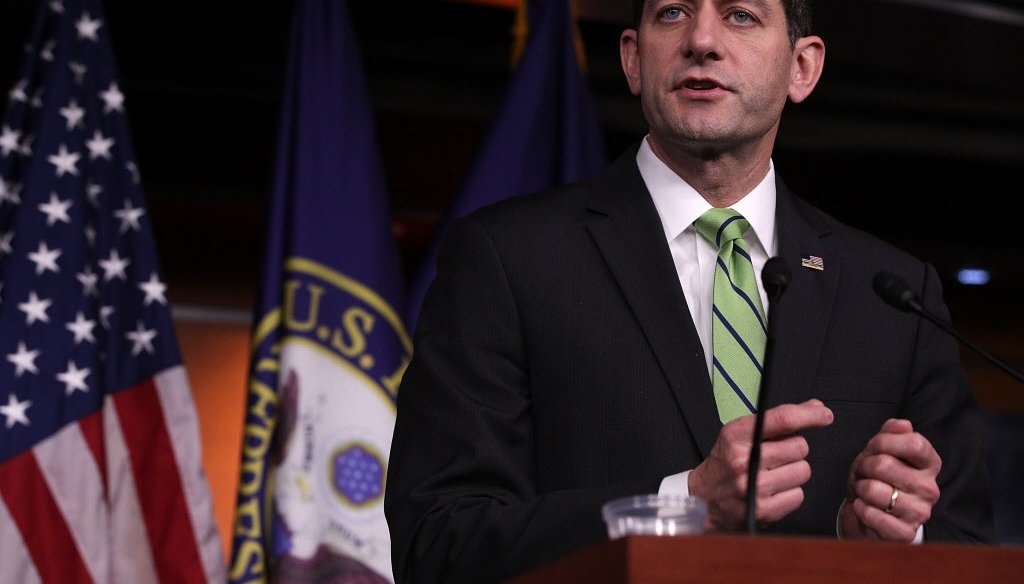
House Speaker Paul Ryan, R-Wisconsin, claimed poverty rates have not changed much since the War on Poverty. (Associated Press photo)
Speaker of the House Paul Ryan rallied the Wisconsin delegation at the Republican National Convention in Cleveland, highlighting his ideas to address some of the country’s biggest issues.
First on Ryan’s "A Better Way" list: Poverty.
"We think there are better solutions to fighting poverty because we see what the War on Poverty has produced," Ryan said at the delegate breakfast. "It produced tens of trillions of dollars in spending. It has been a 51-year exercise and yet the poverty rates in America today are not much better than when we started the War on Poverty."
In his 1964 State of the Union address, President Lyndon B. Johnson launched what became known as the War on Poverty, declaring: "Our aim is not only to relieve the symptom of poverty but to cure it and, above all, to prevent it."
Johnson wanted to expand the federal government’s role to reduce a poverty rate that at the time was about 19 percent.
A few major initiatives passed, including measures to establish Medicare and Medicare, give permanency to food stamps and boost funding for primary and secondary education.
In January, PolitiFact National checked another claim from Ryan on poverty. He said, "today, if you were raised poor, you’re just as likely to stay poor as you were 50 years ago."
An analysis of income and educational-attainment data backed up Ryan’s point showing that "intergenerational mobility" has "remained extremely stable." The claim was rated True.
Is Ryan right with this claim too?
Measuring poverty
The federal poverty rate, calculated by the U.S. Census Bureau, compares pre-tax cash income against the poverty threshold. The threshold is based on three times the cost of a minimum food diet in 1963, adjusted for inflation.
For 2016, the poverty threshold is $24,300 for a family of four. Anyone falling under that threshold is considered in poverty.
In 2014, the last year for which data is available, more than 46 million Americans were living in poverty. With a population of more than 315 million, that means the poverty rate was 14.8 percent. That’s a decrease of about five percentage points from when Johnson declared the War on Poverty. It’s not a huge drop, but it’s not insignificant either.
Most of the drop came in the first few years of the War on Poverty.
By 1967, the official poverty rate dropped from 19 percent to 14.2 percent -- slightly lower than today. Some of the drop can be attributed to general economic expansion in the 1960s following a recession in 1960 and 1961. Since 1967, the rate has fluctuated between 15 and 11 percent.
Shortcomings in the data
Some issues exist with the official poverty rate, as it doesn’t take into account efforts to reduce poverty.
For example, income is defined as the total pre-tax income of all family members. Assistance programs like tax credits for low-income workers or food-purchasing assistance benefits are not included, so it does not capture all the income of a family from programs aimed at addressing poverty.
Rachel Sheffield, a policy analyst for the Heritage Foundation, said Ryan is on target saying the poverty rate is nearly unchanged in the last 50 years.
"Part of the reason the poverty rate is nearly the same today as it was 50 years ago is that most welfare spending is not accounted for when measuring poverty," she said.
Christopher Wilmer, co-director of the Center on Poverty and Social Policy at Columbia University, said the official poverty rate does not paint a full picture.
"It’s misleading to use trends in the official poverty measure when it’s not including measures taken to address poverty," Wilmer said.
An alternative measuring stick
Another metric, the supplemental poverty rate, was created by the U.S. Census Bureau in 2010 to give deeper understanding of economic conditions and policy effects.
It takes information about what people spend on basic needs like food, clothing and shelter to calculate a poverty threshold. The measure adds non-cash benefits from the government such as the school lunch program or Supplemental Nutrition Assistance Program.
Wilmer and other researchers used the supplemental poverty rate to show historical trends in poverty, finding results more favorable than the official measure suggests.
The team found that with government programs, poverty fell from 26 percent in 1967 to 16 percent in 2012, a 10 percentage point drop.
So government spending has had an effect -- and a larger one than Ryan suggests.
Our rating
Ryan said, "the poverty rates in America today aren’t much better than when we started the War on Poverty."
The official poverty rate has dropped from 19 percent in 1964 to about 15 percent today. Another measure, the supplemental poverty rate, suggests the rate of poverty decreased 10 percentage points over roughly the same time period.
So, over time living conditions have improved with government assistance, but the measure of self-sufficiency has been relatively stagnant.
For a statement that is partially accurate, we rate Ryan’s claim Half True.
Phone interview with Christopher Wimer, co-director, Center on poverty and social policy at Columbia University, July 19, 2016.
Email exchange with Ian Martorana, press secretary, Paul Ryan, July 2016.
Email exchange with Rachel Sheffield, policy analyst, Heritage Foundation, July 2016.
Email exchange with Linda Giannarelli, senior fellow, Income and Benefits Policy Center, Urban Institute, July 2016.
PolitiFact National, Paul Ryan says ‘if you were raised poor, you’re just as likely to stay poor’ as 50 years ago, Jan. 19, 2016.
PolitiFact Oregon, Are there more people living in poverty now than there were 50 years ago?, Oct. 24, 2013.
National Poverty Center at University of Michigan, Poverty in the United States Frequently Asked Questions, 2016.
United States Census Bureau, Income and poverty in the United States: 2014, September 2015.
United States Census Bureau, The supplemental poverty measure: 2014, September 2015.
United States Census Bureau, Living in near poverty in the United States: 1966-2012, May 2014.
National Bureau of Economic Research, Winning the war: Poverty from the great society to the great recession, January 2013.
Washington Post, Everything you need to know about the war on poverty, Jan. 8, 2014.
House Budget Committee, The war on poverty: 50 years later, March 3, 2014.
Demography, Progress on Poverty? New estimates of historical trends using an anchored supplemental poverty measure, June 28, 2016.
Heritage Foundation, Showing the way to self-sufficiency, July 11, 2016.
Heritage Foundation, Setting priorities for welfare reform, Feb. 24, 2016.
Public Discourse, The War on Poverty at Fifty: How to craft policy to help America’s poor, Jan. 8, 2014.


In a world of wild talk and fake news, help us stand up for the facts.