Stand up for the facts!
Our only agenda is to publish the truth so you can be an informed participant in democracy.
We need your help.
I would like to contribute
Paul Sadler says national debt doubled under George W. Bush
Former Texas state Rep. Paul Sadler answered a debate question June 26, 2012, with a call to stop expanding government programs until the federal debt is under control.
Squaring off in Dallas with retired teacher Grady Yarbrough, his opponent in the July 31, 2012, runoff for the Democratic U.S. Senate nomination, Sadler said, "Until we get our financial house in order, we cannot continue to spend money. We just can’t."
The U.S. has "never seen national debt like this," Sadler said. "It doubled during the Bush administration."
We decided to see if Sadler’s claim about debt under President George W. Bush holds up.
Sadler sent us an email with several presidents’ names linked to numbers, such as "Bill Clinton 1.4," and told us the numbers’ sources were the U.S. Treasury, Financial Management Service, Bureau of the Public Debt, Federal Reserve Bank of New York and Office of Management and Budget.
The same figures and sources, listed in the same order, appear on a July 28, 2011, New York Times chart illustrating how much of the federal debt accumulated under each president since 1981.
According to the chart, the Bush administration began with a $5.8 trillion gross federal debt, which grew by $6.1 trillion to reach $11.9 trillion -- an increase of 105 percent, or slightly more than double. The Times ascribed the increase in debt to "tax cuts, the wars in Iraq and Afghanistan, (the) economic downturn in 2001 and recession starting in 2007."
Following a suggestion from Treasury spokesman Matthew Anderson, we found that plugging the fiscal years of Bush’s presidency -- October 2001 through September 2009 -- into the Treasury’s online calculator gives debt figures that tally with the Times graphic. While that period begins nearly nine months into Bush’s presidency, it also aligns with the years over which he held budgetary sway.
Gross federal debt, though, is only one measure of how much the government owes. Because Sadler’s numbers match the Times chart, we started with that statistic, which includes money the federal government owes itself, including for programs such as Social Security and Medicare, in addition to public debt.
Public debt itself is another commonly used measure. Debt held by the public is money borrowed from investors outside the federal government, in the form of Treasury notes and other securities.
Which to use? We consulted Oregon State University political scientist Robert Sahr, who studies U.S. debt, policy, presidents and inflation.
Sahr suggested we use public debt, and emailed us part of a textbook’s explanation of why net public debt, rather than gross debt, is seen as a better measure of how much government is borrowing:
"To understand why, suppose you decided to lend yourself $1,000 this year — you take money from your left pocket and lend it to your right pocket. Clearly this has no effect on your overall wealth. Similarly, one branch of the government borrowing from another creates an asset (a trust fund) as well as a debt, and these exactly offset. Net debt held outside the government is the relevant measure."
We returned to the Treasury calculator and found that during Bush’s fiscal years, public debt rose from $3.3 trillion to $7.6 trillion -- up 130 percent, clearly more than double.
Also, we asked Sahr whether he agreed that debt doubled under Bush.
Adjusted for inflation, he said, public debt did not double, though it came close.
Sahr produced a spreadsheet for us with fiscal year-end debt numbers from the federal Office of Management and Budget. Among the results: As with the Treasury calculator, 2001-2009 public debt in non-inflation-adjusted dollars went up 130 percent. Adjusted for inflation (to 2011 dollars), though, the increase was 88 percent.
Returning to gross federal debt, which was Sadler’s basis: Sahr’s spreadsheet showed the same 105-percent increase in non-inflation-adjusted dollars as the New York Times chart. In 2011 dollars, though, the increase was 70 percent.
Some news analyses have compared changes in debt using inauguration dates. We checked those with the Treasury calculator, finding that from Bush’s first inauguration, January 20, 2001, to the day President Barack Obama took office, January 20, 2009, gross federal debt in non-inflation-adjusted dollars rose from $5.7 trillion to $10.6 trillion, up 86 percent. The calculator didn’t have an amount for public debt January 20, 2001, but says the non-adjusted figure was $6.3 trillion January 20, 2009.
When we checked back in with Sadler, he objected to adjusting the debt changes for inflation, saying by email: "I seriously doubt any holder of the debt or your bank would allow you to adjust your debt for inflation. The amount owed is the amount owed - you don't get to adjust it for inflation."
Sahr said later: "Sure, you’re paying in current dollars. But if you’re looking at the change in debt over eight years, part of the change is the change in the value of the dollar over those years."
A final note: Such accounting and tallies can be read as blaming Bush alone for the increases. As PolitiFact has noted numerous times, such assumptions are overly sweeping. Many factors are at play, including Congress, which votes on many spending decisions affecting the debt.
Our ruling
We see how Sadler reached his conclusion. In raw terms, both the public debt and gross federal debt more than doubled during the fiscal years corresponding to Bush’s presidency. However, adjusting for inflation, gross debt increased 70 percent over those years, while public debt increased 88 percent. That’s not quite doubling.
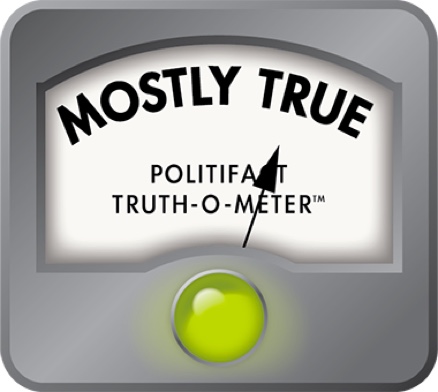
We rate Sadler’s claim Mostly True.
Featured Fact-check
Our Sources
KERA-TV Dallas, "The Texas Debates: Race for U.S. Senate - The Democratic Candidates," June 26, 2012
Telephone and email interviews with Paul Sadler, June 26-July 16, 2012
Telephone and email interviews with Matthew Anderson, July 10-13, 2012
The New York Times chart, "How the U.S. Got $14 Trillion in Debt and Who Are the Creditors," July 28, 2011
U.S. Treasury Department online calculator "The Debt to the Penny and Who Holds It"
Emails and telephone interview with Robert Sahr, associate professor, political science program, Oregon State University School of Public Policy, July 16-19, 2012
Textbook by Charles I. Jones, "Macroeconomics," second edition, January 2011
Browse the Truth-O-Meter
More by Sue Owen
Paul Sadler says national debt doubled under George W. Bush
Support independent fact-checking.
Become a member!
In a world of wild talk and fake news, help us stand up for the facts.


