

When Bend Rep. Jason Conger announced that he will seek the Republican nomination for U.S. Senate in hopes of squaring off against Sen. Jeff Merkley, he outlined his stance on several issues, including poverty.
It’s a timely topic, especially given that a potential crisis could be brewing with regard to food stamp funding. A recession-era boost to the Supplemental Nutrition Assistance Program expires Nov. 1, meaning all recipients will see their benefits drop. Plus, lawmakers are considering additional cuts to the program, which has seen considerable growth in recent years.
That’s all just context, though, for what we’re really interested in. During his announcement, Conger maintained that the long-running War on Poverty (which involves programs such as SNAP) has failed to make much difference. In fact, he said, things are worse than before.
"We’ve been fighting a war on poverty for 50 years and we failed," he said. "There are actually more people in poverty now than there were when we started. We’re spending a trillion dollars on safety net programs. … Does anyone think for any reason that just throwing more money into that same system is going to change the result? Of course not."
Now, folks have probably dedicated careers to trying to determine whether the War on Poverty has succeeded in any meaningful way. Certainly, it’s too complicated a question for a single PolitiFact. But one thing PolitiFact Oregon could check was whether there are "actually more people in poverty now than there were when we started."
The whole concept of the War on Poverty dates to 1964 when President Lyndon B. Johnson introduced legislation that, among other things, created Medicare and Medicaid, and gave permanence to the food stamp program.
The U.S. Census Bureau has been keeping an eye on poverty for decades, stretching back even before Johnson’s reforms. So figures were easy to come by. In the bureau's most recent report on poverty, a helpful graph shows both the number of folks in poverty and the poverty rate (which takes into account the growing population).
The two graphs tell different stories, depending on how you read them.
In terms of whole numbers, Conger is right. About 36 million folks were living in poverty in 1964, and about 46.5 million folks live in poverty today -- obviously an increase. However, if you consider the other graph, you’ll find the poverty rate was 19 percent in 1964 and is about 15 percent now. Truth be told, the rate has been fairly stagnant ever since a drop in the 1960s.
We spoke with Conger about his decision to go with the raw figures over the rate. It came down to accuracy, he said. The more he looked into comparing rates over time, he said, the less he was certain he’d be comparing "apples to apples."
"I didn’t want to distort it or anything," Conger said. "I used the raw number because I know that’s true."
He also pointed out that he could have done something sensational. He could have, for instance, said the number of people living in poverty grew by more than 20 percent since the War on Poverty began, but he said he knew that would be alarmist. "I deliberately didn't do that because I was just trying to make a point."
Now, we’ve done our share of looks at poverty during our time with PolitiFact Oregon, and we know this is a complicated issue. So we turned to an expert, Beth Mattingly, a researcher with the Stanford Center for the Study of Poverty and Inequality.
The big difficulty with measuring poverty, she said, is that while programs aimed at fighting poverty have increased, the government’s method for measuring poverty, which is heavily focused on an individual's cash resources, has not. That means the rate does not take into account several types of assistance, specifically the types Conger was calling ineffective.
Non-cash transfers such as food stamps, energy assistance and nutrition programs for women and children don’t get counted. Neither does the earned income tax credit, one of the bigger tools used for fighting poverty.
"The official poverty number hasn't declined dramatically," Mattingly said, "but it means something different today than it did before the War on Poverty."
Folks who research poverty, including employees of the U.S. Census Bureau, have tried different ways of looking at the poverty rate. One that Mattingly suggested we take a look at is called the Supplemental Poverty Measure, which does pull together the various types of assistance. The measure also takes into account necessary costs to a family or individual, for instance health care or transportation. The idea is that it would offer a more comprehensive measure. Unfortunately, that measure has been around only a few years and doesn’t give us a direct comparison between now and 1964.
So back to our ruling. Conger is correct that more people are in poverty now than in 1964 in terms of raw numbers. But if you look at the rate, which takes population growth into account, we’ve experienced an overall drop. The rate itself, of course, is not perfect, but that seems to be the fairest measure over time, even if it doesn’t take into account many of the programs that came a result of the War on Poverty.
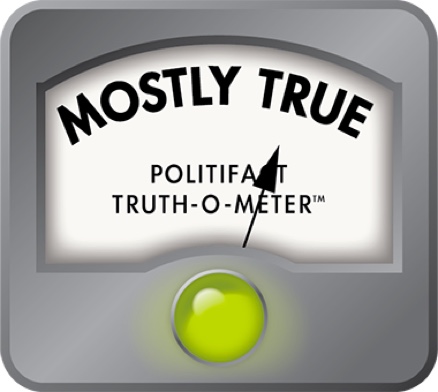
Conger’s statement is accurate but needs that clarification. We rate this claim Mostly True.
Tell us what you think by leaving a comment on OregonLive.com.
Rep. Jason Conger, candidacy announcement speech, Oct. 15, 2013
Interview with Rep. Jason Conger, Oct. 21, 2013
Interview with Beth Mattingly, a researcher with the Stanford Center for the Study of Poverty and Inequality, Oct. 22, 2013
U.S. Census Bureau, "Income, Poverty, and Health Insurance Coverage in the United States: 2012," September 2013
Kathleen Short with the U.S. Census Bureau, "Supplemental poverty measure: 2011," November 2012
In a world of wild talk and fake news, help us stand up for the facts.