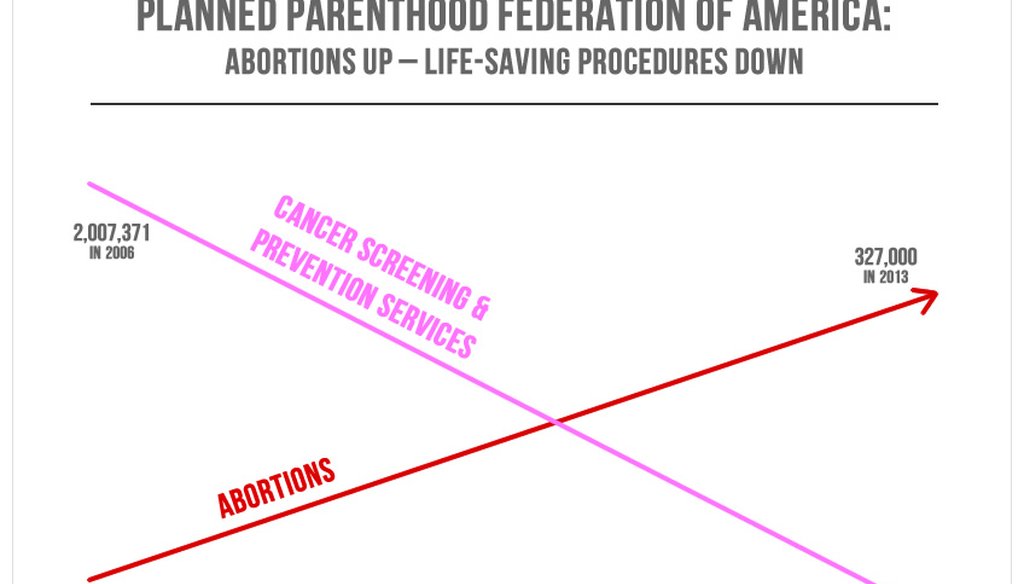

In 2006, Planned Parenthood performed more prevention services and cancer screenings than abortions, but in 2013, there were more abortions.


Rep. Jason Chaffetz, R-Utah, projected this chart during a high-profile congressional hearing investigating Planned Parenthood. (Chart taken from Americans United for Life's website)

Congress may have avoided a government shutdown related to Planned Parenthood funding — at least so far — but the controversy over the women’s health organization looks like it’s here to stay.
Rep. Jason Chaffetz, R-Utah, who chairs the House Oversight and Government Reform Committee, sparred with Planned Parenthood president Cecile Richards during a high-profile hearing on Sept. 29. One of their face-offs originated with a chart Chaffetz flashed, indicating that Planned Parenthood performed more abortions than "life-saving procedures" in 2013, a complete reversal from just seven years ago.
The chart features a pair of lines crossing — one headed upward (abortions) and the other headed downward (cancer screening and prevention services).
When referring to the chart in the hearing, Chaffetz said, "In pink, that's the reduction in the breast exams, and the red is the increase in the abortions. That's what's going on in your organization."
"This is a slide that has never been shown to me before," Richards responded. "Excuse me, my lawyer is informing me that the source of this is actually Americans United for Life, which is an anti-abortion group. So, I would check your source."
"Then we will get to the bottom of the truth of that," Chaffetz agreed.
Many news outlets characterized the chart as misleading, so we too wanted to get to the bottom of the truth.
As it turns out, Richards’ lawyer was correct about the source of the chart -- it comes from an Americans United for Life web post from June 2015.
The chart, we found, gives a misleading impression. The numbers listed on the chart are based on actual statistics, but they are small and were hard to read during the televised hearings. The chart’s most prominent feature — the much larger crossed arrows — suggests a conclusion that’s flat wrong.
We reached out to Chaffetz’s office but did not hear back. A spokesperson for Americans United for Life told PolitiFact that the graphic is accurate and honest.
Experts, however, begged to differ.
"That graphic is a damn lie," said Alberto Cairo, who researches visual communication at the University of Miami. "Regardless of whatever people think of this issue, this distortion is ethically wrong."
Dueling axes
Chaffetz’s chart falls into a category known as a dual-axis chart. On the left side, cancer screenings and prevention services are plotted in the millions. On the right side, abortions are plotted in the hundreds of thousands.
But the way the chart was assembled is problematic.
For starters, dual-axis charts are particularly susceptible to showing spurious correlations. With two axes, trend lines can be exaggerated and manipulated, as most people ignore the axis labels that put the numbers in context.
"It forces your brain to see a relationship that isn’t there," Cairo said. "As economist Gary Smith once said, ‘If you double the axes, you can double the mischief.’ "
Second, it’s even more inappropriate to use a dual-axis chart when comparing equivalent measures (in this case, the number of services performed by Planned Parenthood) using different scales, said Enrico Bertini, a professor at New York University who studies data visualization and who called the chart "scandalous."
Typically, dual-axis charts are used to compare lines that represent different things — "for instance, abortion rates and cost," said Bertini. "But in this case the unit is the same."
"You cannot put two measures, one in the millions and one in the hundreds, without making it explicit," Cairo said. "We map data into visual properties — height, length, color — but we need to keep the proportions. We cannot force the data to adopt a shape we like."
Finally, perhaps the most egregious decision was to not label the axes. Experts told us that, given this decision, they cannot rule out purposeful deception.
"By claiming to combine these two lines into one graph and then omitting the y-axis, we are being misled into to making a false comparison of two non-equivalent contexts," said Noah Iliinsky, a visualization and information designer based in Seattle. "The graph is absolutely misleading, and intentionally so."
Iliinsky also said he saw "propagandized design choices" in the choice of the arrowheads, which suggest a "strong continuation of these trends, which we don’t know to be true."
Corrected charts
With guidance from the experts, we compiled the number of abortions and cancer screenings/prevention services from Planned Parenthood’s annual reports from 2006 to 2013 (we could not find a report from 2008). Here’s what the chart should look like:
As you can see from the chart, the number of abortions provided by Planned Parenthood has essentially held steady, with marginal increases and a modest peak in 2009. It is true, however, that the organization now provides fewer cancer screenings and preventive services, though medical experts said that’s more likely due to changing health guidelines than the organization prioritizing abortions.
Spokespersons for Planned Parenthood and for the American Congress of Obstetricians and Gynecologists both pointed to changing guidelines for Pap smears, the screening test for cervical cancer. Medical groups used to recommend an annual Pap, but now suggests the test every three or five years for most women.
Planned Parenthood also provides an array of other services such as STI/STD testing and treatment — services that have gone up by 50 percent since 2006 — as well as pregnancy tests. Here’s how all of the services have changed from 2006 to 2013:
<
A spokesperson for Planned Parenthood told PolitiFact that the number of services provided in each category tend to fluctuate from year to year for myriad reasons, ranging from changes in laws and medical practices to the opening or closure of Planned Parenthood clinics.
Megan Christin, a spokesperson for the American Congress of Obstetricians and Gynecologists, speculated that the decline in contraception could be due to a growth in the use of IUDs, which last for five to eight years.
Overall, if we compare abortions and non-abortion services provided by Planned Parenthood — and if we use standard scales on the axes, we see largely consistent trend lines for both:
Our ruling
At the hearing, Chaffetz presented a chart that showed the number of abortions at Planned Parenthood rising higher than the number of preventive services and cancer screenings between 2006 and 2013.
But that’s inaccurate, disputed by the chart’s own, hard to read numerical labels. In fact, there were three times as many cancer screenings and prevention services as abortions in 2013. Experts in data presentation said this was an egregious example of using a chart to mislead.
We rate the claim Pants on Fire.
Email interview with Kristi Hamrick, spokesperson for Americans United for Life, Sept. 30, 2015
Email interview with Megan Christin, spokesperson for the American Congress of Obstetricians and Gynecologists, Sept. 30, 2015
Phone and email interview with Erica Sackin, spokesperson for Planned Parenthood, Sept. 30, 2015
Email interviews with Enrico Bertini, professor of computer science and engineering at New York University, Oct. 1, 2015
Email interview with Noah Iliinsky, visualization and information designer, Oct. 1, 2015
Phone and email interviews with Alberto Cairo, professor of communication at the University of Miami, Oct. 1, 2015
Americans United for Life, AUL Releases "The New Leviathan": The Mega-Centers Report, How Planned Parenthood Has Become Abortion, Inc., June 24, 2015
Americans United for Life, "AUL Debunks Abortion Industry Falsehoods About a Simple Fact: Planned Parenthood Doing More Abortions and Fewer Health Screenings," Sept. 30, 2015
Planned Parenthood, 2013-2014 Annual Report,
Planned Parenthood, 2012-2013 Annual Report
Planned Parenthood, 2011-2012 Annual Report
Planned Parenthood, 2010-2011 Annual Report
Planned Parenthood, 2009-2010 Annual Report
Planned Parenthood, 2007-2008 Annual Report
Planned Parenthood, 2006-2007 Annual Report
Vox, "Whatever you think of Planned Parenthood, this is a terrible and dishonest chart," Sept. 29, 2015
Mother Jones, "Lying With Charts, Anti-Abortion Edition," Sept. 29, 2015
PunditFact, "Fox Business reporter: 95% of Planned Parenthood's 'pregnancy services' were abortions," Aug. 4, 2015
Washington Post Fact Checker, "For Planned Parenthood abortion stats, ‘3 percent’ and ’94 percent’ are both misleading," Aug. 12, 2015


In a world of wild talk and fake news, help us stand up for the facts.