Get PolitiFact in your inbox.
On Sept. 17, President Donald Trump announced a new round of tariffs on $200 billion more of Chinese goods. That’s only the latest salvo in an ongoing trade dispute with China and other U.S. trading partners.
As tariffs and counter-tariffs hitting the agriculture and manufacturing industries mount ahead of the midterm elections, we decided to revisit some trade basics using five charts.
We’ll run through trade deficits, the United States’ evolving standing in the global trade scene, and the burgeoning trade war.
A trade deficit occurs when a country imports more than it exports. The balance can include manufactured goods, but it also typically includes services, which includes finance, insurance, legal services, business consulting and entertainment.
Trump keeps coming back to the goods deficit because that subset of trade shows how much manufacturing activity the United States has lost to foreign countries in recent years. The United States has instead dominated in services. The export of services comprises a smaller share of trade than goods, but has grown faster.
The graphic below shows the shrinking role of goods and the growing role of services, as well as the portion of GDP the deficit makes up.
There’s a political connection here. Trump thrived in Rust Belt states hard hit by trade deficits in goods, and fared poorly in coastal and metropolitan areas that have benefited from the surge in services.
Economists told us they don’t believe deficits are as terrible as Trump makes them out to be. Some of the biggest declines in the trade deficits were in 2009, 2001 and 2002. Those are also years in which the United States has faced recessions.
"The idea that shrinking trade deficits would be good doesn’t line up with economic history, since they typically coincide with recessions," said Daniel Anthony, vice president of the Trade Partnership. "It’s not that falling imports cause recessions, but a weak economy causes imports – and therefore trade deficits – to fall."
That’s because when the economy is doing well, people buy stuff. Whether they are imported goods or American-made goods using imported materials, that drives up consumption of imports. On the other hand, when the economy suffers, people buy less and imports shrink.
Trade experts don’t all agree, but there are a few possible explanations for why U.S. share of global exports has been declining.
"One reason our share of global exports has been shrinking is that we are a mature advanced economy with a slower overall GDP growth rate than emerging economies," said Mac Destler, a professor at the University of Maryland School of Public Policy.
Another is the value of the dollar. A highly valued dollar is a disadvantage in global trade, as it makes American exports less affordable.
From 2000 to 2005, the trade deficit grew rapidly, as illustrated above. That coincided with a high dollar value, which peaked in 2003. Robert Blecker, an economics professor at American University, said the value’s impact on exports has a two-year lag, so the effect continued until around 2005.
During that time, China was manipulating its currency by fixing the value to the dollar until 2005, according to Blecker. China is a non-negligible factor, as trade with China makes up about half of the United States’ trade deficit.
"They were preventing their currency from rising and the dollar from falling, buying hundreds of billions of dollar a year to keep the dollar artificially high," Blecker said. "It was part of how we got into this in the first place."
Whether China still manipulates its currency is subject to debate. But there has been partial cooperation since 2005, and a rising Yuan until 2017.
The deficit with China in 1990 was $10.4 billion. It grew to $83.8 billion in 2000 and swelled to $273 billion in 2010, according to the Census Bureau. It rose to $375.6 billion in 2017.
Experts don’t exactly agree on the cause, but the basics are as follows.
Following the Tiananmen Square massacre in 1989, Congress held an annual vote to determine whether Chinese goods would face greater tariffs than other countries’ goods. The vote was contingent on human rights progress, according to Edward Alden, a senior fellow at the Council on Foreign Relations.
When China joined the World Trade Organization in 2001 during the presidency of George W. Bush, foreign investors got the green light to build operations in China with confidence that access to the U.S. market would not be interrupted.
The resulting investment, coupled with currency manipulation, made China an exporting juggernaut, widening the gap each year.
While a deficit also exists with Mexico, the story is very different. Unlike China, Mexico (and the rest of North America) has a trade deficit with the rest of the world.
The North American Free Trade Agreement, which went into effect in 2004, assured investors that Mexico was also a safe bet. Coupled with other incentives for foreign investors, Mexico’s export market blossomed.
But China hurt Mexico, too. Both were labor-intensive manufacturers in similar industries, so when China came in with much lower wages and an undervalued currency, Mexico took a hit.
The one sector in which Mexico thrived was automobiles, which accounts for most of the trade gap with the United States. Mexico’s leg-up is significantly lower wages, owed in part to union prohibitions, according to Alden. That’s why the United States is pushing for higher wage requirements in the NAFTA renegotiation.
As the chart shows, the gap between Mexico and the United States is significantly smaller than with China, as Mexico is a big importer of U.S. goods. Trade gaps with individual countries can be deceiving, however.
That’s because with a global supply chain, no good is made solely in one country and shipped to another. So imports reported as coming from Mexico are more like imports from China assembled in Mexico. Accounting for those factors actually widens the trade gap with China and shrinks the gap with Mexico, Blecker said.
Tariffs are taxes on certain imports from another country paid by a country’s own population. They raise prices for manufacturers, which are passed onto customers, or for customers directly. Other countries retaliate by putting their own tariffs on U.S. goods sold in their own countries.
Tariffs are normally relatively low, and agreed to through trade agreements or the World Trade Organization. They can be raised when extreme trade conditions arise, but they are usually set off by an international legal investigation.
Blecker said that for a president to apply unilateral tariffs to countries or products this extreme is unprecedented. The Trump administration used two loopholes to do so, relating to national security and unfair foreign trade practices. Retaliation ensued.
Trump set off the dispute by putting tariffs on solar panels and washing machines in January. He went on to tax steel and aluminum imports. U.S. allies like Canada, Mexico and the European Union were drawn in and in turn, retaliated. But the main target of the tariffs has been China. The first round of tariffs went into effect July 6.
If Trump follows through on all his proposed tariffs, Trump will have placed levies on nearly every product from China.
While trade is a key tenet of the Trump administration, many Republicans in Congress oppose his trade policies. Speaker of the House Paul Ryan, R-Wis., said "There are better ways to help American workers and consumers" after Trump’s steel and aluminums tariffs in May.
Supporting or opposing the tariffs has been a key question in the North Dakota Senate race, where farmers are feeling the sting of the trade war. While Kevin Cramer, the Republican challenger to Heidi Heitkamp, has criticized tariffs as a long term solution, he has largely echoed Trump.
PolitiFact has tracked a number of trade claims this election season.
In July, U.S. Agriculture Department Secretary Sonny Perdue said farmers, who will receive $12 billion in aid, took a disproportionate hit from retaliatory tariffs.
Mostly True. While it’s difficult to measure the impact of tariffs, the economy sets up agricultural producers to bear their brunt.
Trump blamed trade deals for falling soybean prices, a trend that began in 2012.
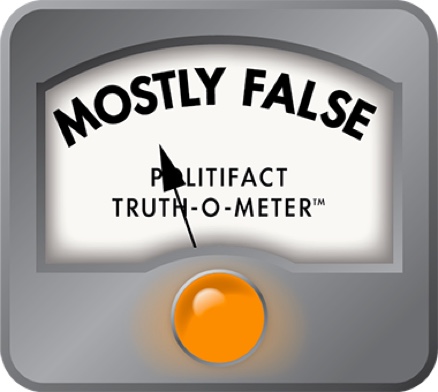
Mostly False. On the supply side, weather is the single most important factor, followed closely by more productive growing techniques. China is the biggest buyer of U.S. soybeans, and they don’t have a trade deal with the United States. It does have a trade deal with Mexico, where sales gradually increased and plateaued in recent years.
Trump also blamed China for a $500 billion loss in trade.
Mostly False. Overall, in terms of both goods and services, the United States trade deficit with China in 2017 was around $336 billion — meaning Trump was off by roughly $164 billion.
Editor's note, Sept. 24, 2018: PolitiFact has joined an effort with other North American fact-checkers to examine statements about trade and tariffs. Poynter.org is documenting the project; see its report for links to other fact-checks.
Editor's note, Sept. 24, 2018: The U.S.-China trade war 2018 chart was updated to better reflect visually the proportion of tariffs to to total imports and exports. The text is unchanged.
Our Sources
Bloomberg, Trump Wants $200 Billion in China Tariffs Despite Talks, Sources Say, Sept. 14, 2018
New York Times, How Trump’s Trade War Went From 18 Products to 10,000, July 11, 2018
Email interviews with David Laborde, senior researcher at International Food Policy Research Institute, Sept. 21, 2018
Phone interview with Edward Alden, senior fellow at the Council on Foreign Relations, Sept. 17, 20, 2018
Phone interview with Daniel Anthony, vice president of the Trade Partnership, Sept. 18, 2018
Phone interview with Robert Blecker, economics professor at American University, Sept. 21, 2018
Email interview with Mac Destler, professor at the University of Maryland School of Public Policy, Sept. 19, 2018
Census, Trade in Goods with Mexico, last revised July 12, 2018
Census, Trade in Goods with China, last revised July 12, 2018
Peterson Institute for International Economics, Trump’s Latest $200 Billion Tariffs on China Threaten a Big Blow to American Consumers
World Bank, Exports of goods, services and primary income
See individual fact-checks and charts for sources.


