Says 57 percent of federal spending goes to the military and just 1 percent goes to food and agriculture, including food stamps.


Our only agenda is to publish the truth so you can be an informed participant in democracy.
We need your help.
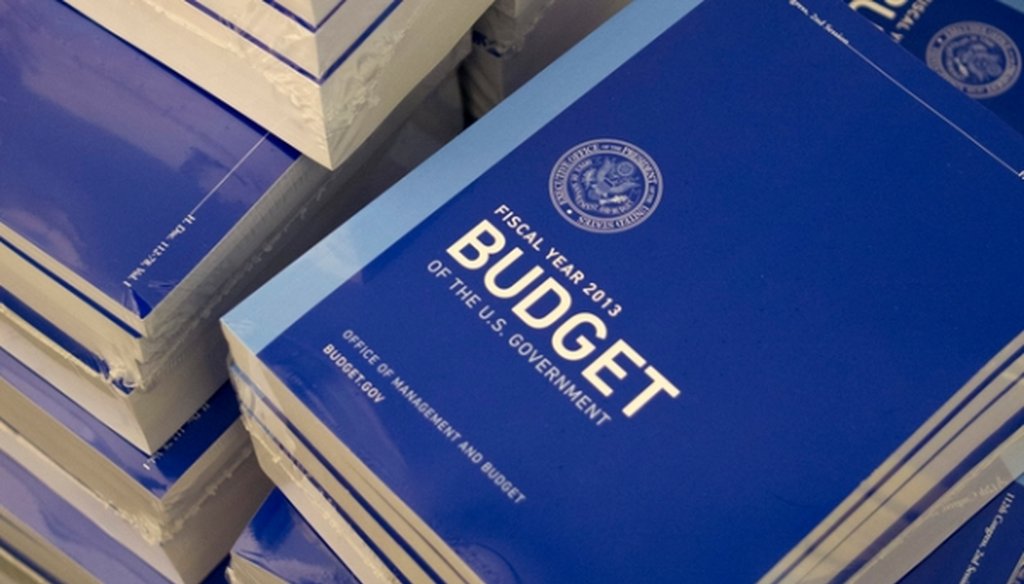
What goes into the federal budget? Not what a pie chart circulating on social media says.

Is federal spending on the military about 50 times higher than on food stamps? That’s the message of a pie chart now circulating on the Internet.
The pie chart is headlined, "Look closely at this chart of federal spending." It says spending on the "military" accounts for 57 percent of the federal dollar, with other categories ranging from 1 percent to 6 percent.
The caption says, "Somewhere within the tiny orange sliver at the bottom is the food stamp program that Republicans blame for our budget deficit. And so ends today’s lesson in Republican logic."
To check the accuracy of this pie chart, we had to make a few assumptions. For starters, the chart isn’t dated, so we used estimated figures for fiscal year 2015. And since the chart uses some non-standard categories for federal spending, we had to make a few assumptions about which departmental spending should be placed in what category.
That said, we found some fundamental problems with the graphic’s calculations and conclusions. To understand them, we’ll first provide some background on how federal spending works.
Most federal spending can be categorized as discretionary or mandatory. The levels of discretionary spending are determined through the congressional appropriations process, with both houses of Congress and the president ultimately signing off on an agreed level of spending. Most spending by cabinet departments and independent agencies falls under this category, and it’s "discretionary" in the sense that if political leaders want to raise, or lower, the amount of spending for a given purpose, they can do so by tinkering with appropriations bills.
The other major category is mandatory spending, which is sometimes referred to as "entitlements." Spending within this category is determined by a formula, and the big pieces are three familiar programs: Social Security, Medicare and Medicaid. For each mandatory program, the amount spent is tied directly to the number of people deemed eligible by age or income level. These programs effectively run on autopilot unless Congress changes the formula, making this type of spending more insulated from lawmakers and the president than discretionary spending.
With that background, let’s now take a look at how the figures in the pie chart compare to a breakdown of fiscal 2015 discretionary spending (the third column), and to fiscal 2015 total spending (that is, discretionary plus mandatory spending, in the final column).
Category of spending
Percent listed in meme
Category's share of 2015 discretionary spending
Category's share of all 2015 spending (including both discretionary and mandatory spending)
Defense and homeland security
57
54
16
Education
6
6
3
Veterans
6
1
4
Housing and Urban Development
5
3
1
Health and Human Services
5
9
28
State Department and foreign aid
3
5
2
Energy and EPA
3
7
1
Science and NASA
3
2
1
Transportation
3
2
4
Labor


2
1
1
Food and agriculture
1
2
4
Social Security
0
1
25
Remainder*
6
7
9
* "Remainder" includes legislative branch, judicial branch, independent agencies and departments of Commerce, Interior, and Treasury, minus offsetting receipts.
The pie chart’s figures aren’t far off if you’re looking just at discretionary spending, though even here there are some differences. For instance, the pie chart significantly understates the amount of spending going to health and energy.
More problematic, though, is that the pie chart ignores mandatory spending. About 60 percent of all federal spending is considered mandatory, with 34 percent considered discretionary and 6 percent devoted to interest. In other words, the chart, despite referring broadly to "federal spending," only counts about one-third of federal spending -- the discretionary part.
If we look at all of federal spending, the picture changes:
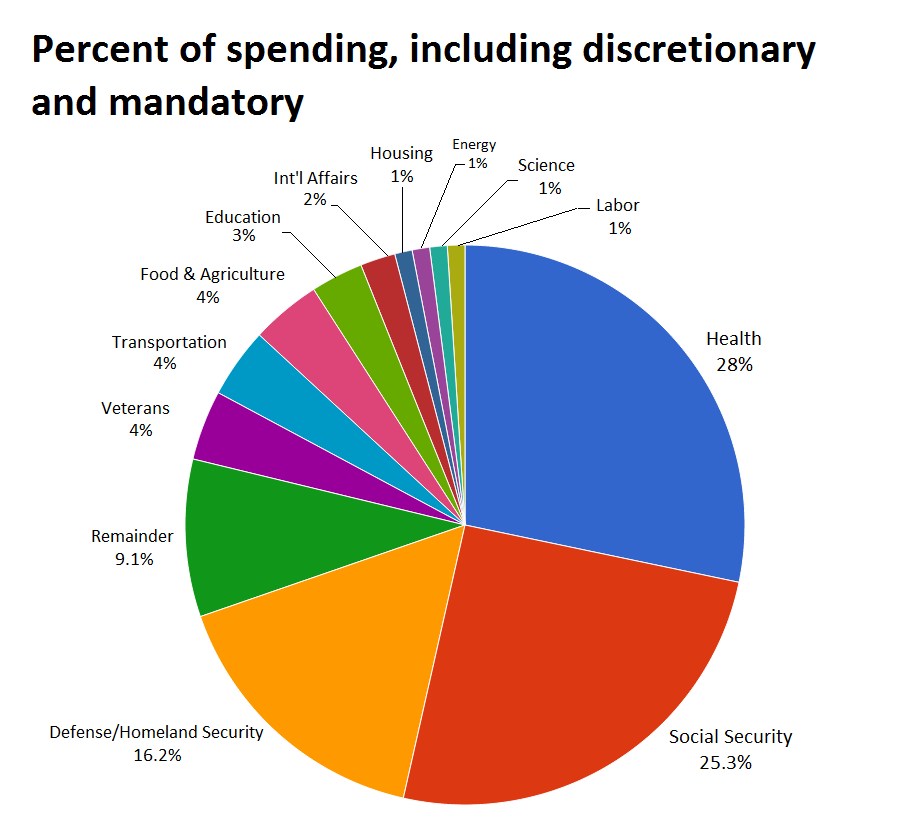
• The "military" share, including spending on homeland security, shrinks from 57 percent to 16 percent.
• The "health" share zooms from 5 percent to 26 percent, once expenditures on Medicare and Medicaid are counted.
• Social Security -- a category not even included in the pie chart now circulating on social media feeds -- rises from 0 percent to 25 percent.
• Food and agriculture quadruples from 1 percent to 4 percent due to the inclusion of food stamps, a mandatory program, and agricultural income and price supports.
Calculating it this way severely undercuts the graphic’s message. Rather than the federal budget being dominated by the military, the budget is actually dominated by spending on Social Security, Medicare and Medicaid. In fact. the ratio of military spending to food and agriculture spending in the full budget is 4-to-1, rather than 57-to-1.
A more accurate representation would be this one:
Our ruling
A social-media meme says that 57 percent of federal spending goes to the military and just 1 percent goes to food and agriculture, including food stamps.
To get numbers that approximate this, the pie chart cherry-picks just discretionary spending. But that means the pie chart represents only about one-third of federal spending. Once you include the 60 percent of the budget that is mandatory spending, the military share plunges from 57 percent to 16 percent, and the categories that include Social Security, Medicare and Medicaid collectively account for a majority of federal spending. Spending on food and agriculture is still small, but it does quadruple from 1 percent to 4 percent.
Due to its skewed methodology, the pie chart offers a deeply distorted picture of federal spending. We rate the claim False.
Pie chart circulating on social media, received by PolitiFact Aug. 13, 2015
Office of Management and Budget, Table 5.3—Percentage Distribution of Budget Authority by Agency: 1976–2020, accessed Aug. 13, 2015
Office of Management and Budget,Table 5.5—Percentage Distribution of Discretionary Budget Authority by Agency: 1976–2020, accessed Aug. 13, 2015
Congressional Budget Office, "An Analysis of the President’s 2016 Budget," March 2015
Email interview with Joshua Sewell, senior policy analyst with Taxpayers for Common Sense, Aug. 13, 2015


In a world of wild talk and fake news, help us stand up for the facts.
 Politifact Rating: