
Our only agenda is to publish the truth so you can be an informed participant in democracy.
We need your help.


President Barack Obama gestures as he answers a question during a news conference in the White House state dining room on Oct. 2, 2015. (AP/Pablo Martinez Monsivais)
During an Oct. 2 press conference dominated by discussion of a mass shooting in Oregon and the ongoing civil war in Syria, President Barack Obama took time out for a victory lap on the federal budget.
"I want to repeat this because the public apparently never believes it," Obama said. "Since I took office, we’ve cut our deficits by two-thirds. The deficit has not been going up; it has been coming down -- precipitously. We’ve cut our deficits by two-thirds. They’re below the average deficits over the past 40 years."
We have previously rated Obama’s claim that "we've cut the deficit by two-thirds" as Mostly True. But we hadn’t heard the other claim -- that today, the deficit is "below the average deficits over the past 40 years." So we took a closer look.
Economists tend to make long-term comparisons using a measurement of the deficit as a percentage of gross domestic product. (The gross domestic product, or GDP, is a measure of the overall size of the U.S. economy.) Looking at the deficit as a percentage of GDP takes account of the economy’s dramatic growth since 1975. A larger economy can sustain a larger budget, and thus a larger deficit.
Using that yardstick, Obama’s claim is on target.
We calculated the current deficit as a percentage of GDP by dividing the Congressional Budget Office’s $426 billion deficit estimate (which was released in September) by the nearly $18 trillion estimate for GDP in 2015 (which was released in August). That works out to a deficit that’s 2.4 percent of GDP.
So how does that figure compare? We looked at historical data for the deficit as a percentage of GDP going back to 1975, as published by the Office of Management and Budget. When we averaged those annual percentages, the average worked out to be a little under 3.2 percent.
That would make Obama’s claim correct. Indeed, the percentage has fallen from 9.8 percent in 2009 to 2.4 percent today.
This may be easier to visualize through the graph below. The blue line shows the deficit as a percentage of GDP, year by year, for the last 40 years, with the red line denoting the 40-year average. Though the percentage has been quite a bit above-average for most of Obama’s tenure, it has fallen significantly and has now fallen below the 40-year average, at least based on current-year estimates.
And even if you keep unusually high percentages during the Obama years out of the calculation and limit the comparison to 1975 to 2008, the current level (a deficit that’s 2.4 percent of GDP) is still slightly lower than the average going back to 1975 (2.5 percent).
In our previous fact-checks of Obama’s claims on the deficit, we’ve noted that Obama has glossed over the long-term outlook, which is not as rosy. Programs such as Medicare, Medicaid and Social Security will become increasingly expensive as the Baby Boom generation ages.
This can be seen in the following graph from the Congressional Budget Office. Over the next decade, the deficit as a percentage of GDP is set to push closer and closer to 4 percent, which is above the average level for the past 40 years. (In this graph, deficit percentage figures are shown as negative, rather than as positive in the graph above.)
Our ruling
Obama said today’s deficit is "below the average deficits over the past 40 years."
He’s correct when measuring the deficit as a percentage of GDP, which is the yardstick most economists tend to use when making deficit comparisons over long periods of time. Still, Obama didn’t specify that he was talking about deficits as a percentage of GDP, and the comparison’s accuracy depends on the absence of major budgetary and economic changes between now and time the fiscal 2015 data are finalized.
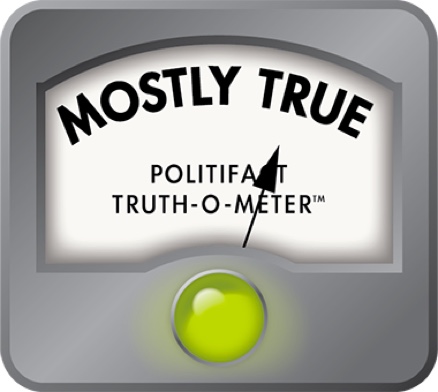
The claim is accurate but needs clarification or additional information, so we rate it Mostly True.
Barack Obama, remarks at a press conference, Oct. 2, 2015
Office of Management and Budget, Table 1.1—Summary of Receipts, Outlays, and Surpluses or Deficits (-): 1789–2020, accessed Oct. 6, 2015
Office of Management and Budget, Table 1.2—Summary of Receipts, Outlays, and Surpluses or Deficits (-) as Percentages of GDP: 1930–2020, accessed Oct. 6, 2015
Congressional Budget Office, "An Update to the Budget and Economic Outlook: 2015 to 2025," August 2015
Congressional Budget Office, "Monthly Budget Review for August 2015," Sept. 8, 2015
Email interview with Steve Ellis, vice president of Taxpayers for Common Sense, Oct. 6, 2015
In a world of wild talk and fake news, help us stand up for the facts.
