Get PolitiFact in your inbox.
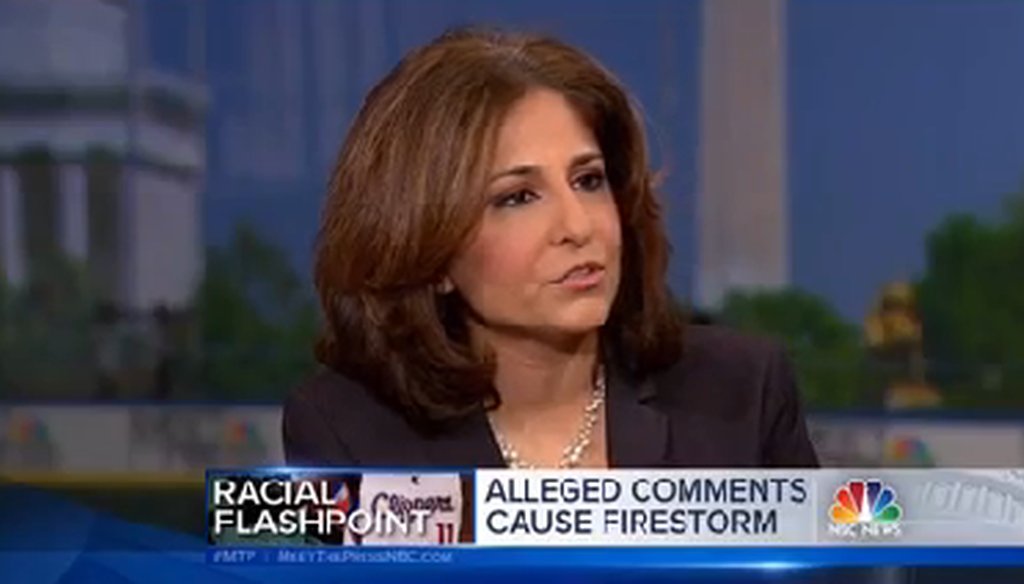
Neera Tanden appeared on "Meet the Press" on April 27, 2014.

Pundits on Sunday spun two news events -- the Supreme Court’s 6-2 decision allowing states to effectively ban affirmative action, and racist comments allegedly made by Los Angeles Clippers owner Donald Sterling -- into a discussion melding race and income inequality.
The statistics they cited were largely on the mark.
On ABC’s This Week, Fusion reporter Alicia Menendez argued that differences in wealth in the United States aren’t just generational, they’re racial.
"We also know that there is a racial component to this, that a white family is likely to have about six times as much wealth than a black or Hispanic family coming out of the recession," she said.
That’s actually on the low end of the research, experts told PunditFact.
Menendez pointed us to an April 2013 reportfrom the Urban Institute, a nonpartisan social policy think-tank. The institute measured mean wealth by race. Using 2010 data from the Survey of Consumer Finances, the Urban Institute looked at assets including cash savings, homes, retirement accounts and subtracted any debt.
The Urban Institute concluded that, post-recession, for every $1 an average black or Hispanic person has in wealth, an average white person has $6. That’s up from 1983, the farthest back the study goes, when the ratio was 5-to-1.
At the higher end of the spectrum, Pew Research cited a 20-to-1 ratio in 2011. They took median wealth from the Census Bureau’s Survey of Income and Program Participation 2009 data. So the data varies by survey used, year and measure of average (mean vs median).
There is debate among economists and social scientists about which ratio is the most accurate. Darrick Hamilton, an urban policy professor at The New School, said the Census Bureau surveys more low-income families, while the Survey of Consumer Finances oversamples high-income families where minorities aren’t as well represented.
Overall, any ratio from 6-to-1 to 22-to-1 could be considered an accurate measure of the wealth gap, Thomas Shapiro, a Brandeis University social policy professor who studies the wage gap, told us.
We rated Menendez’s statement True.
The talk about income inequality continued on NBC’s Meet the Press.
Neera Tanden, head of the Center for American Progress, a pro-Democratic group, argued that Democrats and Republicans can both gain political ground by addressing growing income inequality.
"95 percent of the income gains in the last few years have gone to the top 1 percent, That's a fact in the country," Tanden said. "I think this is going to be an issue on both the right and the left."
The claim that the top earners have done extremely well coming out of the recession has come upbefore. While there is some debate over the details, Tanden is on solid ground.
The statement goes back to a study from University of California-Berkeley economist Emmanuel Saez. In the years from 2009 to 2012, Saez found that the income flowing to families in the top 1 percent of families went up by over 30 percent, while for the rest, income grew by less than half a percent.
"Hence, the top 1 percent captured 95 percent of the income gains in the first three years of the recovery," Saez wrote.
The main caveat with Saez’s work is that he used preliminary data for 2012 and didn’t include two significant kinds of income -- money from the government (Social Security, welfare, food stamps, etc.) or the value of health insurance benefits. Saez focused on employment wages, capital gains, dividends and interest. Using capital gains but not government income would tend to skew the results toward the wealthy.
There is also an argument that it makes more sense to calculate consumption rather than income.Economist Aparna Marthur with the American Enterprise Institute, a free-market oriented think-tank in Washington, believes what people spend shows you how well people are actually living, and it doesn’t matter if they pay for it using credit cards, their weekly paycheck or their savings. Viewed this way, the situation is not as bad.
"We find that consumption inequality is much narrower than income inequality," Marthur said. "And has shown no trend towards widening over the last few decades."
Lastly, experts say the time period Saez chose might have skewed the results.
"The economic cycle messes up this comparison," said Eugene Steurele with the Urban Institute. "In recovering from a recession, if an unemployed person stays with the same unemployment benefits, and a wage earner doesn’t increase her wages, but the stock market recovers enough so there are more capital gains, then one might get these types of results."
Steurele said Saez’s findings are useful but his approach simplifies a complex situation. Because of those caveats, we rated Tanden’s claim Mostly True.
Julie Kliegman and Jon Greenberg contributed to this report. Aaron Sharockman is the editor of PunditFact.com.
Our Sources
See individual fact-checks.