
"The average tax bill for Americans in 2016 was a 41 percent increase from 2013."


As Congress prepared to debate a high-stakes tax bill, a reader asked us to check a letter about tax policy emailed by Rep. Lamar Smith, R-Texas.
"A new report by the Bureau of Labor Statistics shows that in 2016 Americans spent more on taxes than they did on food and clothing combined," Smith wrote. "In fact, taxes were the second-largest expenditure of American families. The average tax bill for Americans in 2016 was a 41 percent increase from 2013."
We zeroed in on the final assertion in that paragraph. Spread over a three-year period, a 41 percent bump in taxes would be significant.
We found that even though Smith's factoid comes from a federal agency, it is a flawed comparison, and it fails to capture accompanying growth in income as well as other statistics that show the tax burden increased by a more modest amount.
Smith’s office confirmed that the statistic comes from the most recent annual installment of the Consumer Expenditure Survey, which the BLS released in late August. The specific figure that Smith cited comes from this document.
Average taxes paid, according to the survey, were $7,432 in 2013, but they rose to $10,489 in 2016. That’s a 41 percent increase, as Smith wrote.
One important bit of context that’s missing: This figure ignores that average income increased over the same three-year period as well.
Here’s a chart summarizing income, taxes and taxes as a percentage of income.
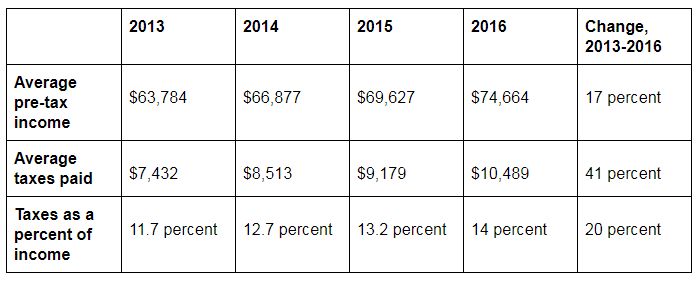
As the chart shows, a 17 percent rise in pre-tax income explains some of the increase in taxes paid. Taxes as a percentage of income rose by 20 percent. That’s about half the 41 percent increase Smith cited.
In addition, the statistic Smith cited doesn’t communicate the reality that richer taxpayers saw a much bigger increase than taxpayers of more typical means.
When broken down into quintiles -- the top one-fifth of earners, the second one-fifth and so on -- the increase from 2013 to 2016 was 29.1 percent for those in the middle quintile, compared to 44.6 percent for the fifth, or highest, income quintile.
That said, the survey shows a substantial increase in taxes paid overall -- an increase well beyond the growth of income.
There’s an important caveat, however: The BLS told us about a stumbling block in comparing 2013 and 2016 numbers.
Basically, the bureau made a methodological change that results in an exaggerated increase in taxes paid during that time period.
"There was definitely an increase, but the magnitude need to be interpreted carefully due to differences in how the (survey) measures taxes and income," Steven Henderson, chief of BLS’s division of consumer expenditure surveys, told PolitiFact.
BLS changed its methodology in 2013, but the change was undertaken in a way that makes the 2013 figures for taxes paid lower than they were in subsequent years, Henderson said. The 2013 tax data is "lower and less reliable for comparison to later years," he said.
"I interpret this to mean that it is inappropriate to compare calculated Consumer Expenditure Survey estimates of personal taxes in 2013 with the calculations for any later date," said Gary Burtless, a Brookings Institution economist, of Henderson's explanation.
Is there an alternative way to assess how much taxes rose from 2013 to 2016? As it happens, there are at least two.
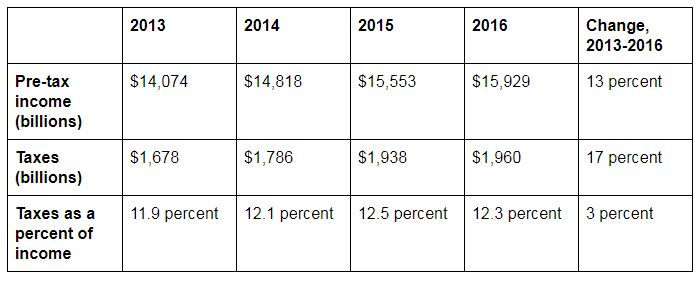
One source is the Bureau of Economic Analysis, a division of the U.S. Commerce Department.
According to this data, taxes rose by 17 percent over the same three-year period, well below the 41 percent in Smith’s letter. And over that same period, income rose by 13 percent. This means that taxes did rise faster than income did, but only modestly.
As a result, taxes as a percentage of income increased by only 3 percent between 2013 and 2016 (and the figure even fell slightly between 2015 and 2016). That’s quite a bit smaller than the 20 percent we found in the Consumer Expenditure Survey data. Here’s a summary of the Bureau of Economic Analysis data.
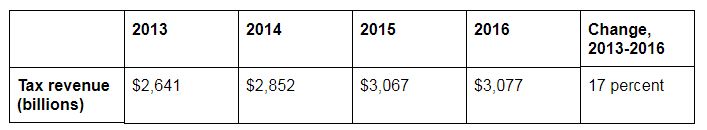
A second data source is the nonpartisan Congressional Budget Office. We didn’t see income data in the CBO’s tables, but we did find the total amount of tax revenues generated for 2013 to 2016. And the percentage increase in tax revenues was essentially identical to what the Bureau of Economic Analysis found -- 17 percent -- and less than what Smith had written.
Some of the contradictions in the numbers are explained by the various collection methods. The Consumer Expenditure Survey is based on a survey of a sampling of Americans -- 28,000 interviews per year, along with approximately 7,000 more detailed interactions through voluntary diaries. The Bureau of Economic Analysis and the Congressional Budget Office, by contrast, measure actual, comprehensive data reported by the federal treasury.
In addition, the tax data in the Consumer Expenditure Survey is estimated by BLS from the reported income totals rather than being reported directly by the household participating in the survey. This means that the survey data is less solid than the other measures, which count actual dollars received. And the Consumer Expenditure Survey offers an average, "typical" case, whereas the other two sources offer total amounts of income and taxes for the country as a whole.
The big takeaway? There was an increase in taxes paid in the period Smith identified. But it isn't as big as 41 percent.
Smith wrote that "the average tax bill for Americans in 2016 was a 41 percent increase from 2013."
Smith has accurately cited the results of the federal Consumer Expenditure Survey, even though he’s glossed over the simultaneous increases in income and the fact that increases for richer taxpayers drove that increase.
However, the survey’s leadership acknowledged to PolitiFact that, for technical reasons, the 2013-to-2016 comparison is undercut by methodological differences. An alternative measurement using different federal data showed that taxes, after adjusting for income increases over the same period, rose by 3 percent.
That’s an increase, but a more modest one. So we rate the statement Half True.
Lamar Smith, letter to a constituent, Sept. 18, 2017
Bureau of Labor Statistics, "Average annual expenditures and characteristics of all consumer units, Consumer Expenditure Survey, 2013-2016," accessed Sept. 27, 2017
Bureau of Economic Analysis, "Table 2.1. Personal Income and Its Disposition," accessed Sept. 27, 2017
Congressional Budget Office, "Revenues, by Major Source, Since 1967," accessed Sept. 27, 2017
Email interview with Dean Baker, co-director of the Center for Economic Policy and Research, Sept. 27, 2017
Email interview with Jed Kolko, chief economist at Indeed.com, Sept. 27, 2017
Email interview with Gary Burtless, senior fellow at the Brookings Institution, Sept. 27, 2017
Email interview with Steven Henderson, chief of the Bureau of Labor Statistics' division of consumer expenditure surveys, Sept. 28, 2017
Email interview with Jennifer Pett, spokeswoman for Lamar Smith, Sept. 28, 2017


In a world of wild talk and fake news, help us stand up for the facts.
 PolitiFact Rating: